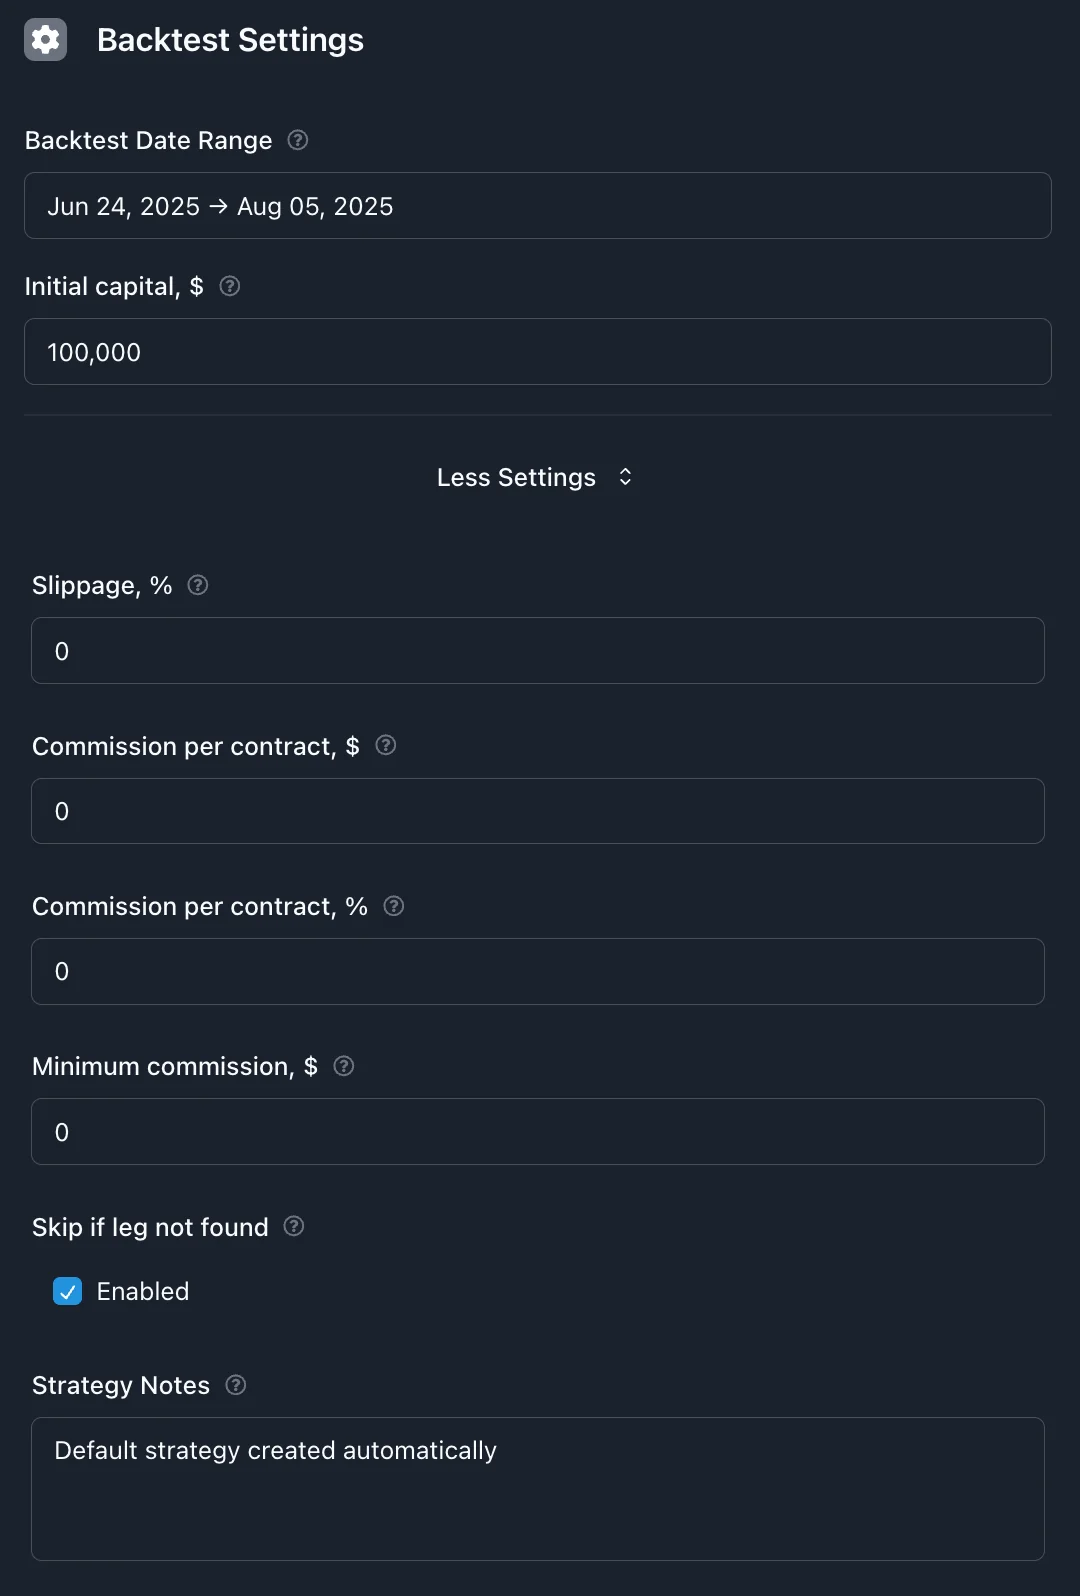
Configure backtest dates range, capital, transaction costs, and other simulation parameters
Backtest Settings
Set up your backtest to simulate how your strategy would have performed with real market data. These settings help make your backtest results as realistic as possible.
Testing Period
Choose the time period you want to test your strategy against. This is when your strategy will be "trading" in the simulation.
Quick Select Presets
Use the Quick Select dropdown to instantly set up common testing periods:
Recent Performance:
Last 7 days: Very short-term testing
Last 30 days: Recent month performance
Month to date: Current month so far
Year to date: Current year performance
Last 365 days: Rolling one-year period
Last 2 years: Two-year rolling window
Market Events & Conditions:
SPX Daily Expirations: Since May 2022 when daily SPX options launched
COVID Crash: Feb 20 - Mar 23, 2020 (market crash period)
2020-2021 Bull Market: Mar 24, 2020 - Dec 31, 2021 (recovery period)
Meme Stock Frenzy: January 2021 (GME/AMC volatility)
Volmageddon: Jan 26 - Feb 28, 2018
💡 Tip:
Try testing your strategy across different market events to see how it handles various conditions. The preset periods make it easy to test specific scenarios.
How Long Should You Test?
3-6 Months: Quick Testing
Good for: Testing new ideas quickly
Benefits: Fast results, easy to iterate
Limitation: May miss seasonal patterns
1-2 Years: Standard Testing
Good for: Most strategies
Benefits: Captures different market conditions
Recommended: Best balance of thoroughness and speed
3+ Years: Comprehensive Testing
Good for: Final validation before live trading
Benefits: Multiple market cycles and volatility periods
Limitation: Takes longer to run
⚠️ Important:
Include both calm and volatile periods in your test to see how your strategy handles different market conditions.
Starting Capital
Set the amount of money your virtual account starts with. This determines how many contracts you can trade and affects your percentage returns.
💡 Tip:
Use an amount close to what you'd actually trade with. This makes your backtest results more meaningful for real trading decisions.
Trading Costs
Add realistic trading fees to see how they affect your strategy's profitability. Most brokers charge a fee for each options contract you trade.
Commission Per Contract
This is how much your broker charges for each options contract you buy or sell.
Common Broker Fees:
Robinhood, Webull: $0.00 (commission-free)
TD Ameritrade, E*TRADE: $0.65 per contract
Interactive Brokers: $0.65 per contract (but lower for high volume)
Traditional Full-Service: 1.00−3.00+ per contract
💡 Example:
Iron Condor Trade (4 legs, 1 contract each):
Open position: 4 contracts × $0.65 = $2.60
Close position: 4 contracts × $0.65 = $2.60
Total cost: $5.20 in commissions
⚠️ Important:
Even small commission fees can significantly impact short-term strategies or strategies with frequent trading.
Slippage
Slippage accounts for the reality that you rarely get the exact mid-market price when trading. It represents the cost of crossing the bid-ask spread and market impact.
What Slippage Means
When you see an option quoted at $2.00, that might be the mid-price between a $1.95 bid and $2.05 ask. In reality:
Buying: You'll probably pay closer to $2.05 (or higher)
Selling: You'll probably receive closer to $1.95 (or lower)
Slippage simulates this real-world trading cost as a percentage of the option premium.
Recommended Slippage Settings
0% - Perfect World
Assumes you always get mid-market prices
Unrealistic but useful to see best-case performance
1-2% - Typical Retail Trader
Realistic for most individual traders
Recommended starting point: 1.5%
3-5% - Conservative Estimate
Accounts for poor market conditions or wide spreads
Good for stress testing your strategy
💡 Example:
Iron Condor selling for $300 premium with 2% slippage:
Perfect execution: Collect $300
With slippage: Actually collect $294 ($6 less)
When closing at 50% profit target: Pay $153 instead of $150
Additional Settings
Skip Missing Options
Recommended: Keep this ON
When your strategy looks for specific options (like a 16-delta put), sometimes those exact options don't exist in the historical data. With this setting enabled:
ON: Skip the trade entirely if any leg is missing (recommended)
OFF: Open whatever legs are available (can create unintended positions)
⚠️ Important:
Keeping this ON ensures your backtests only include the exact strategies you intended to test.
Quick Setup Guide
For Most Strategies
Good starting settings that work for most people:
Testing Period: 1-2 years of recent data
Starting Capital: $50,000 (or close to what you'd actually use)
Commission: Your broker's actual rate (check their website)
Slippage: 1.5%
Skip Missing Options: ON
Testing Different Market Conditions
Try these periods to see how your strategy handles different markets:
Bull Market: January 2017 - January 2020
Bear Market: January 2022 - December 2022 High Volatility: March 2020 - December 2020
Low Volatility: January 2017 - December 2017
Common Mistakes to Avoid
Don't use unrealistic settings like 0% commission and 0% slippage. Your backtest will look too good and disappoint in real trading.
Using perfect execution costs: Real trading has costs
Testing only good markets: Include volatile and down periods
Wrong position sizes: Match your actual trading capital
Next Steps
Once you've set up your backtest parameters, you're ready to run your test and analyze the results to see how your strategy performed.