Analyzing Results
Understanding performance metrics and insights
Analyzing Backtest Results
After running a backtest, GreeksLab shows you how your strategy performed with charts, metrics, and detailed analysis.
Results Page Overview
The backtest results page has five tabs:
- Overview: Key metrics and performance charts
- Insights: Performance breakdown by market conditions
- Positions: Individual trade details
- Daily: Day-by-day performance
- Strategy: Your strategy settings snapshot
Overview Tab
Shows your strategy's overall performance with key metrics and charts.
Key Metrics

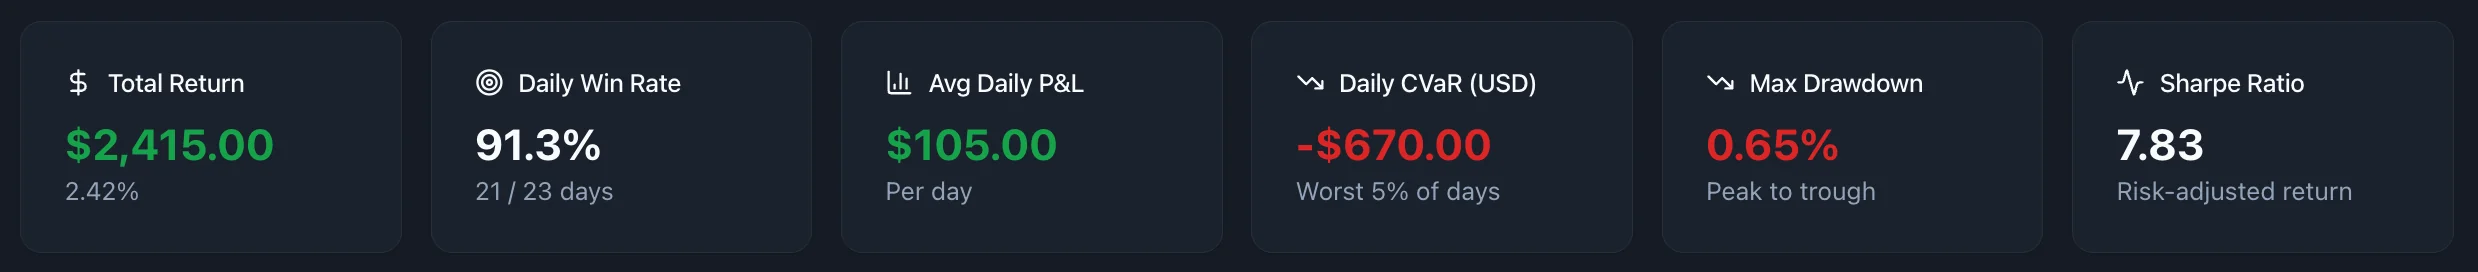
Six key performance indicators displayed at the top:
- Total Return: Dollar amount and percentage gain/loss
- Daily Win Rate: Percentage of profitable trading days
- Average Daily P&L: Mean profit/loss per day
- Daily CVaR: Average of worst 5% of trading days
- Max Drawdown: Largest peak-to-trough decline
- Sharpe Ratio: Risk-adjusted return measure
Charts
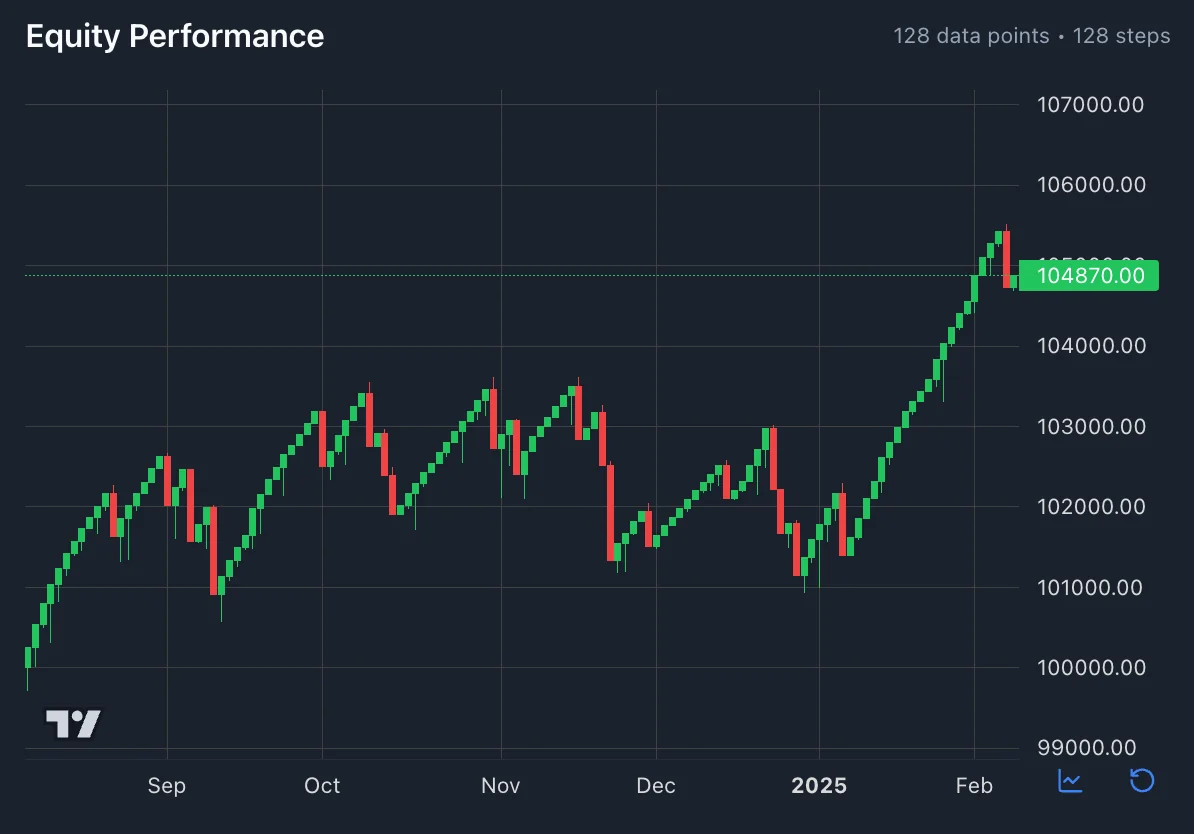
Performance Chart: Main equity curve showing account balance over time

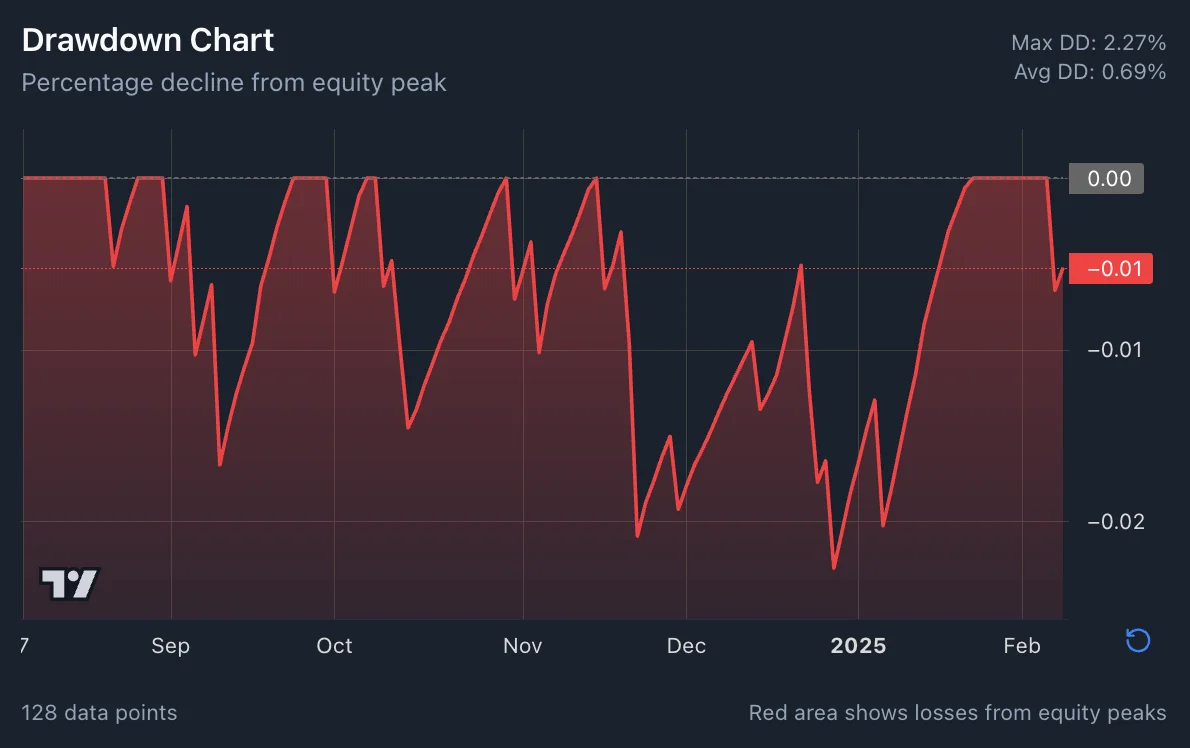
Drawdown Analysis: Shows depth and duration of losing periods

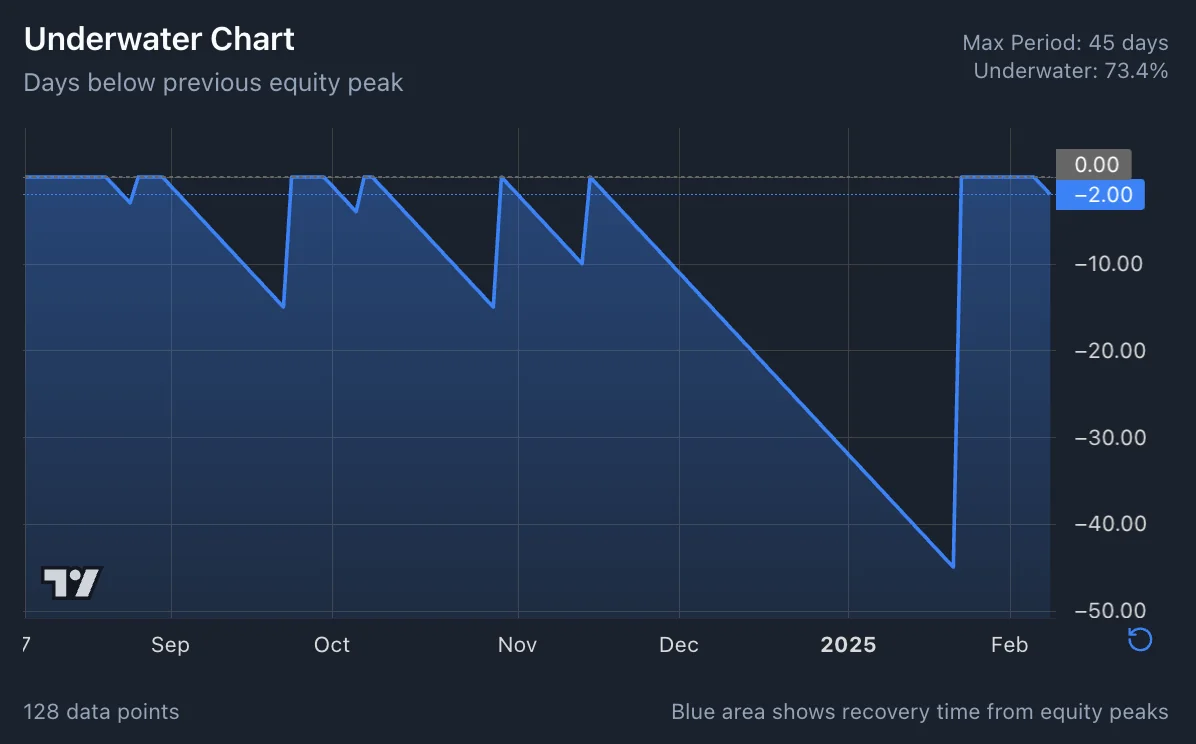
Underwater Analysis: Time spent below previous equity highs

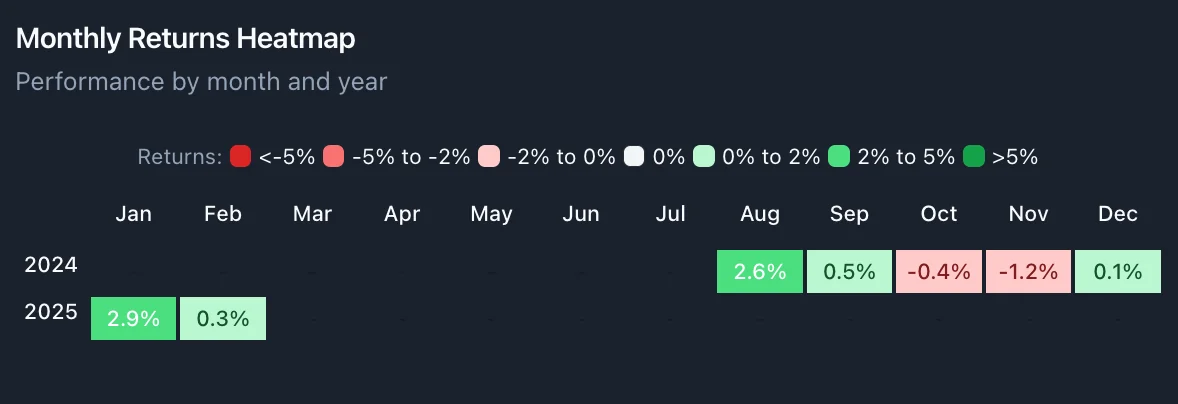
Monthly Returns Heatmap: Monthly performance with color coding

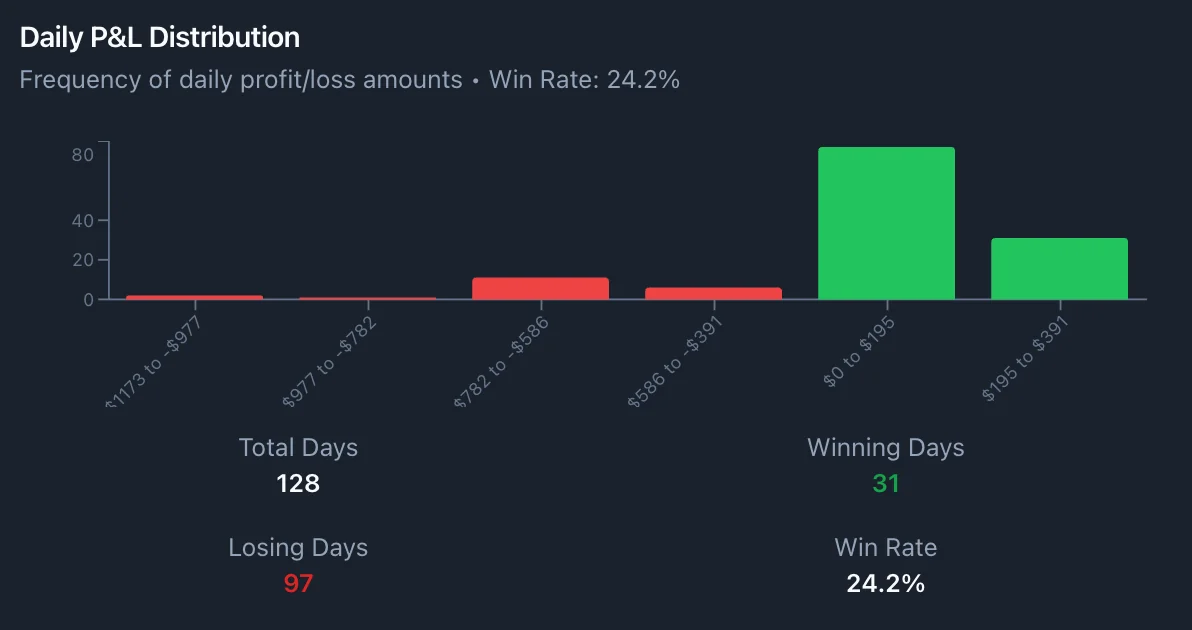
P&L Distribution: Frequency of different daily P&L outcomes

Performance Statistics
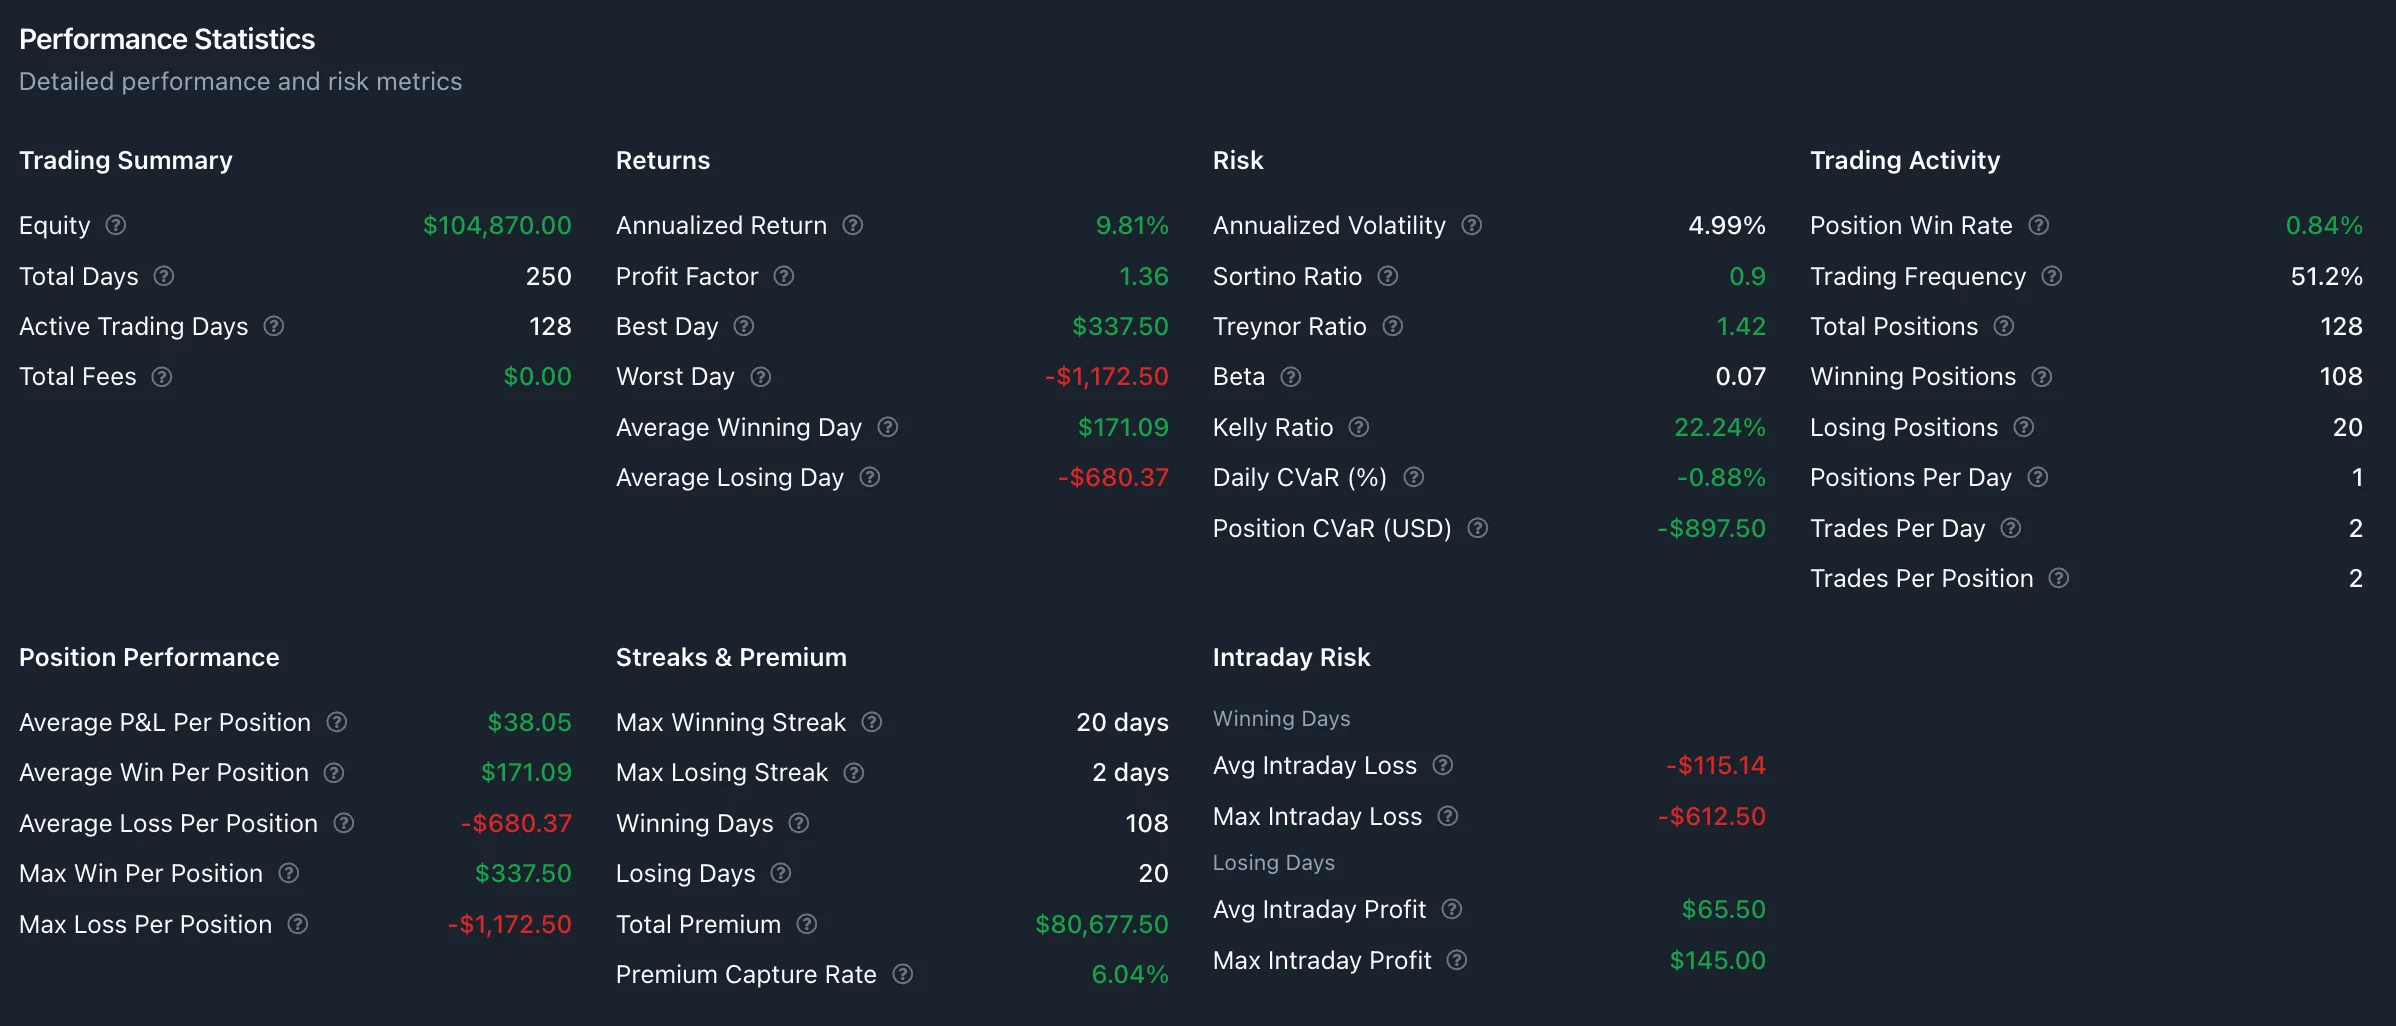
Below the charts, you'll find detailed performance metrics including return statistics, risk metrics, and trade statistics.

Insights Tab
Analyzes your strategy's performance across different market conditions and factors.

Categories
Market Environment: VIX levels, overnight gaps, market movements
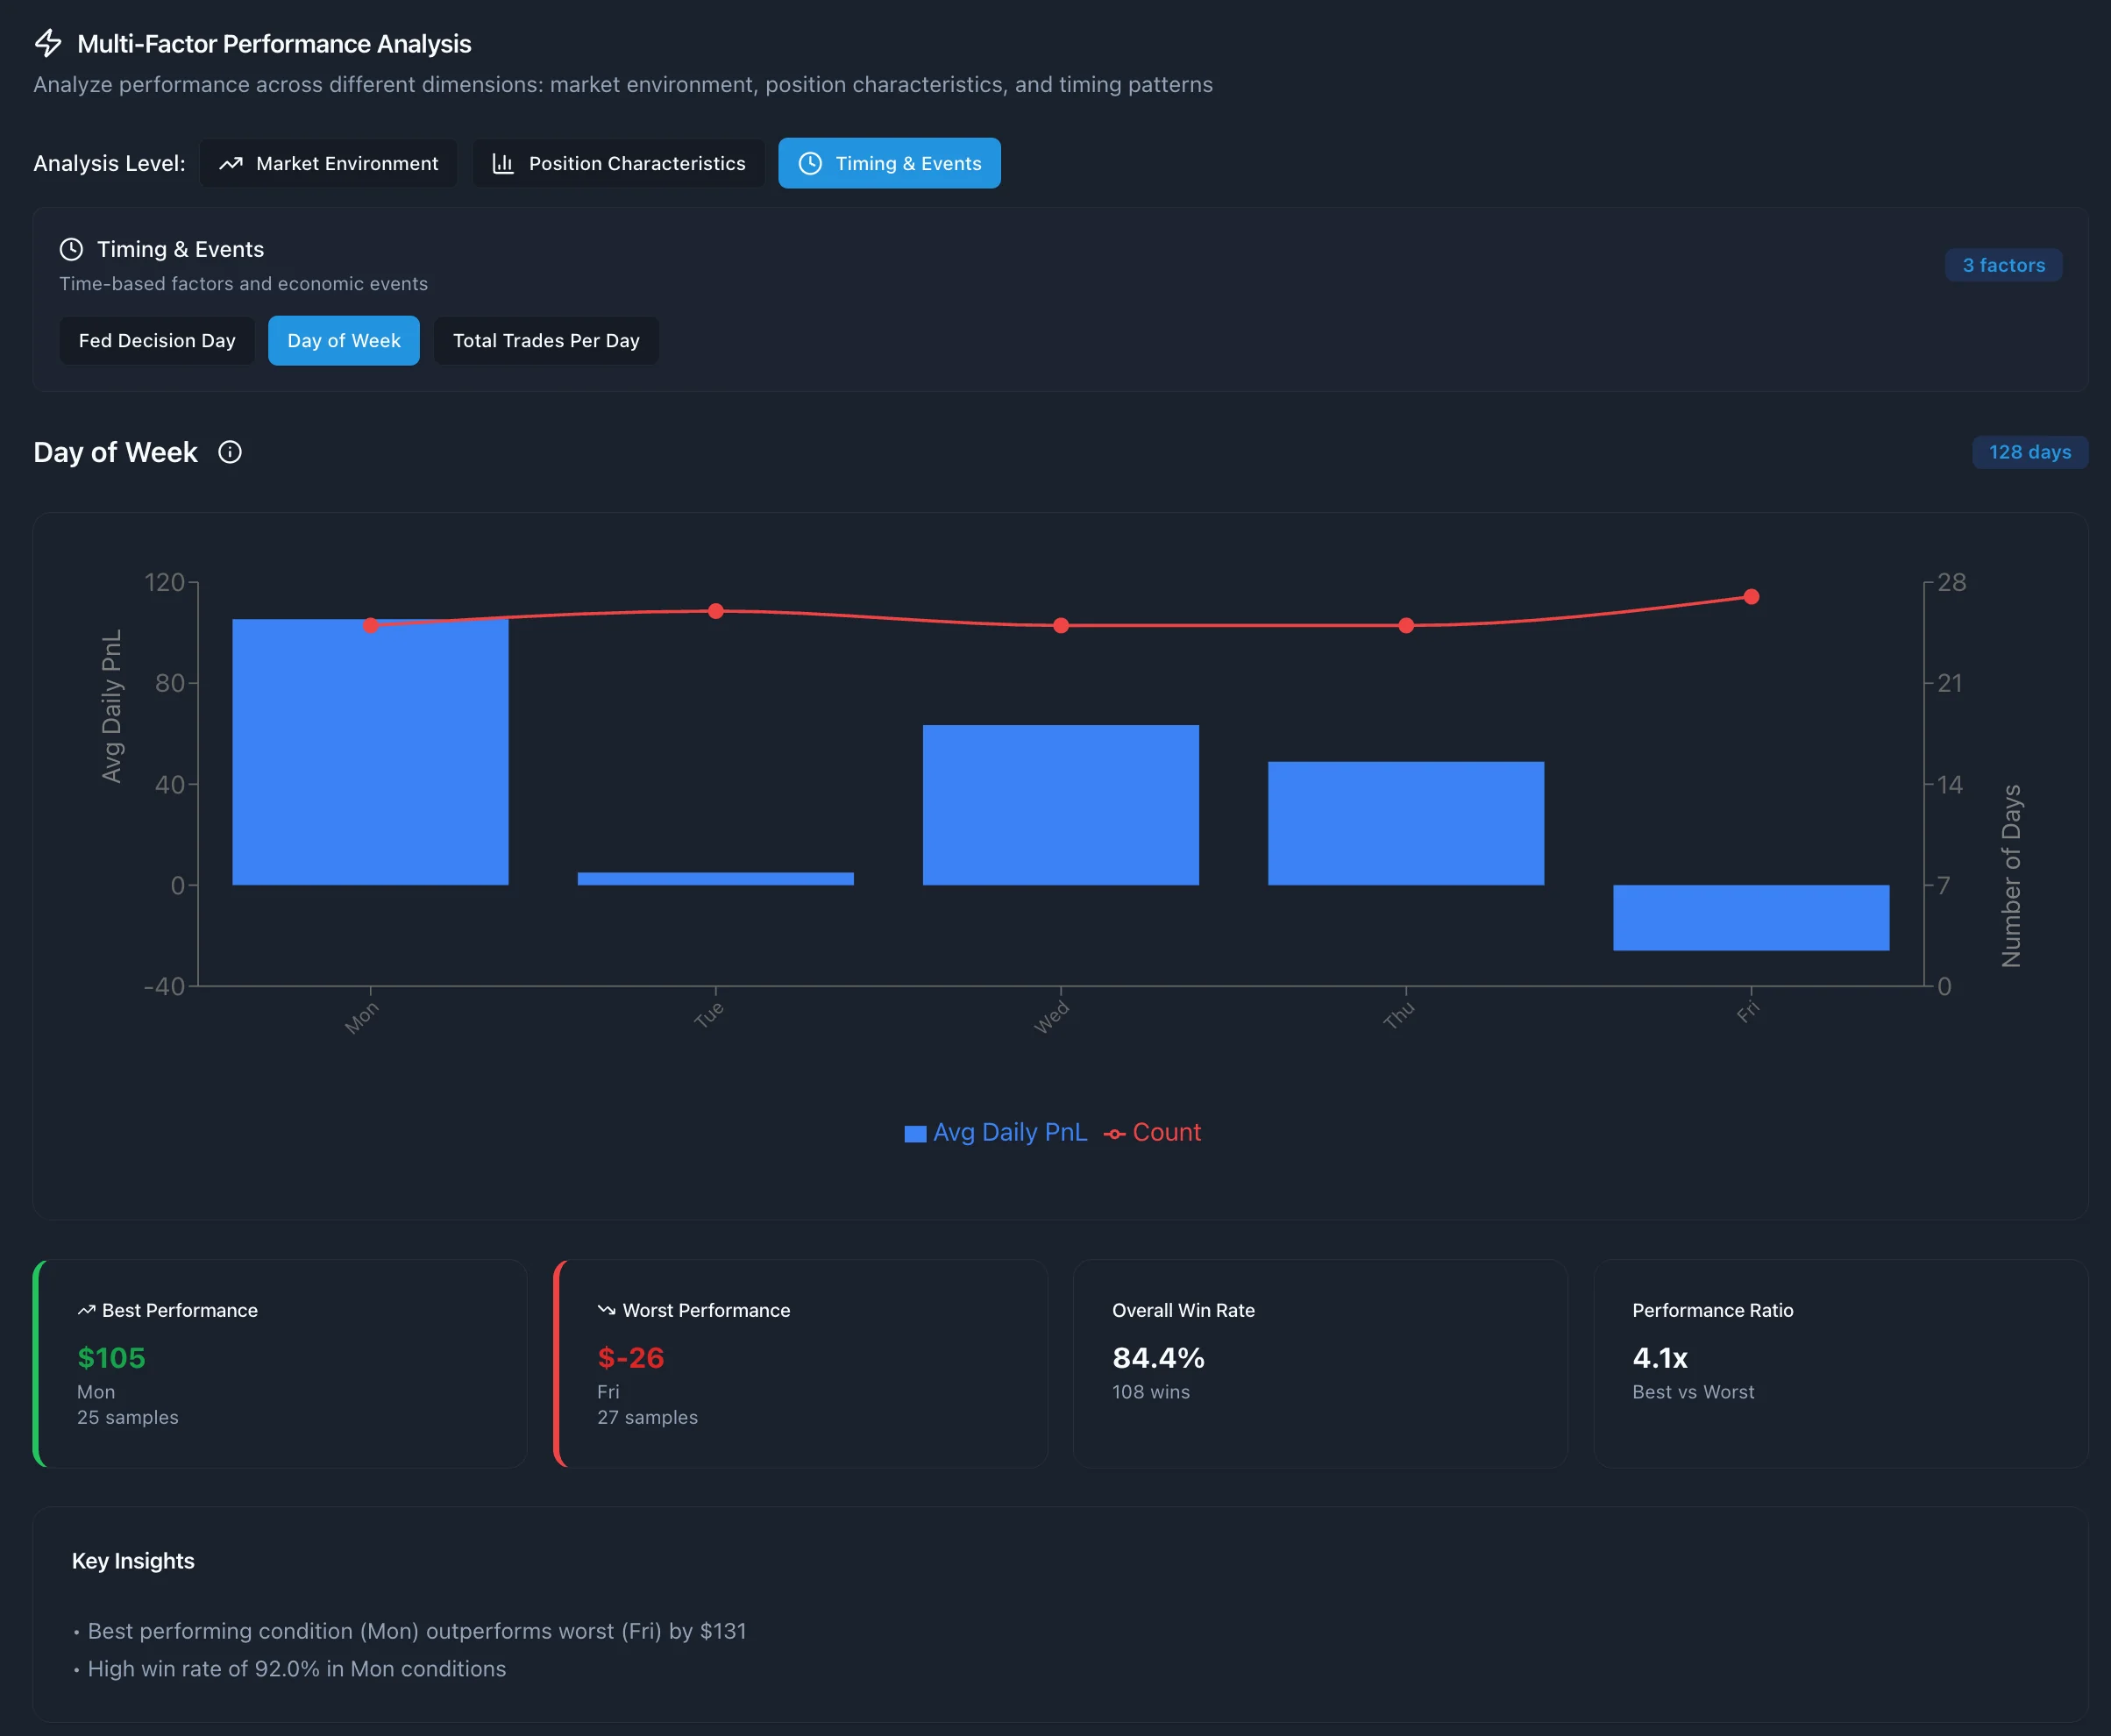
Time-Based: Entry hour, day of week, seasonality
Position Structure: DTE, premium levels, delta exposure
Position Templates: Performance by strategy template
Use the category tabs and factor selection to explore what drives your performance.
Positions Tab
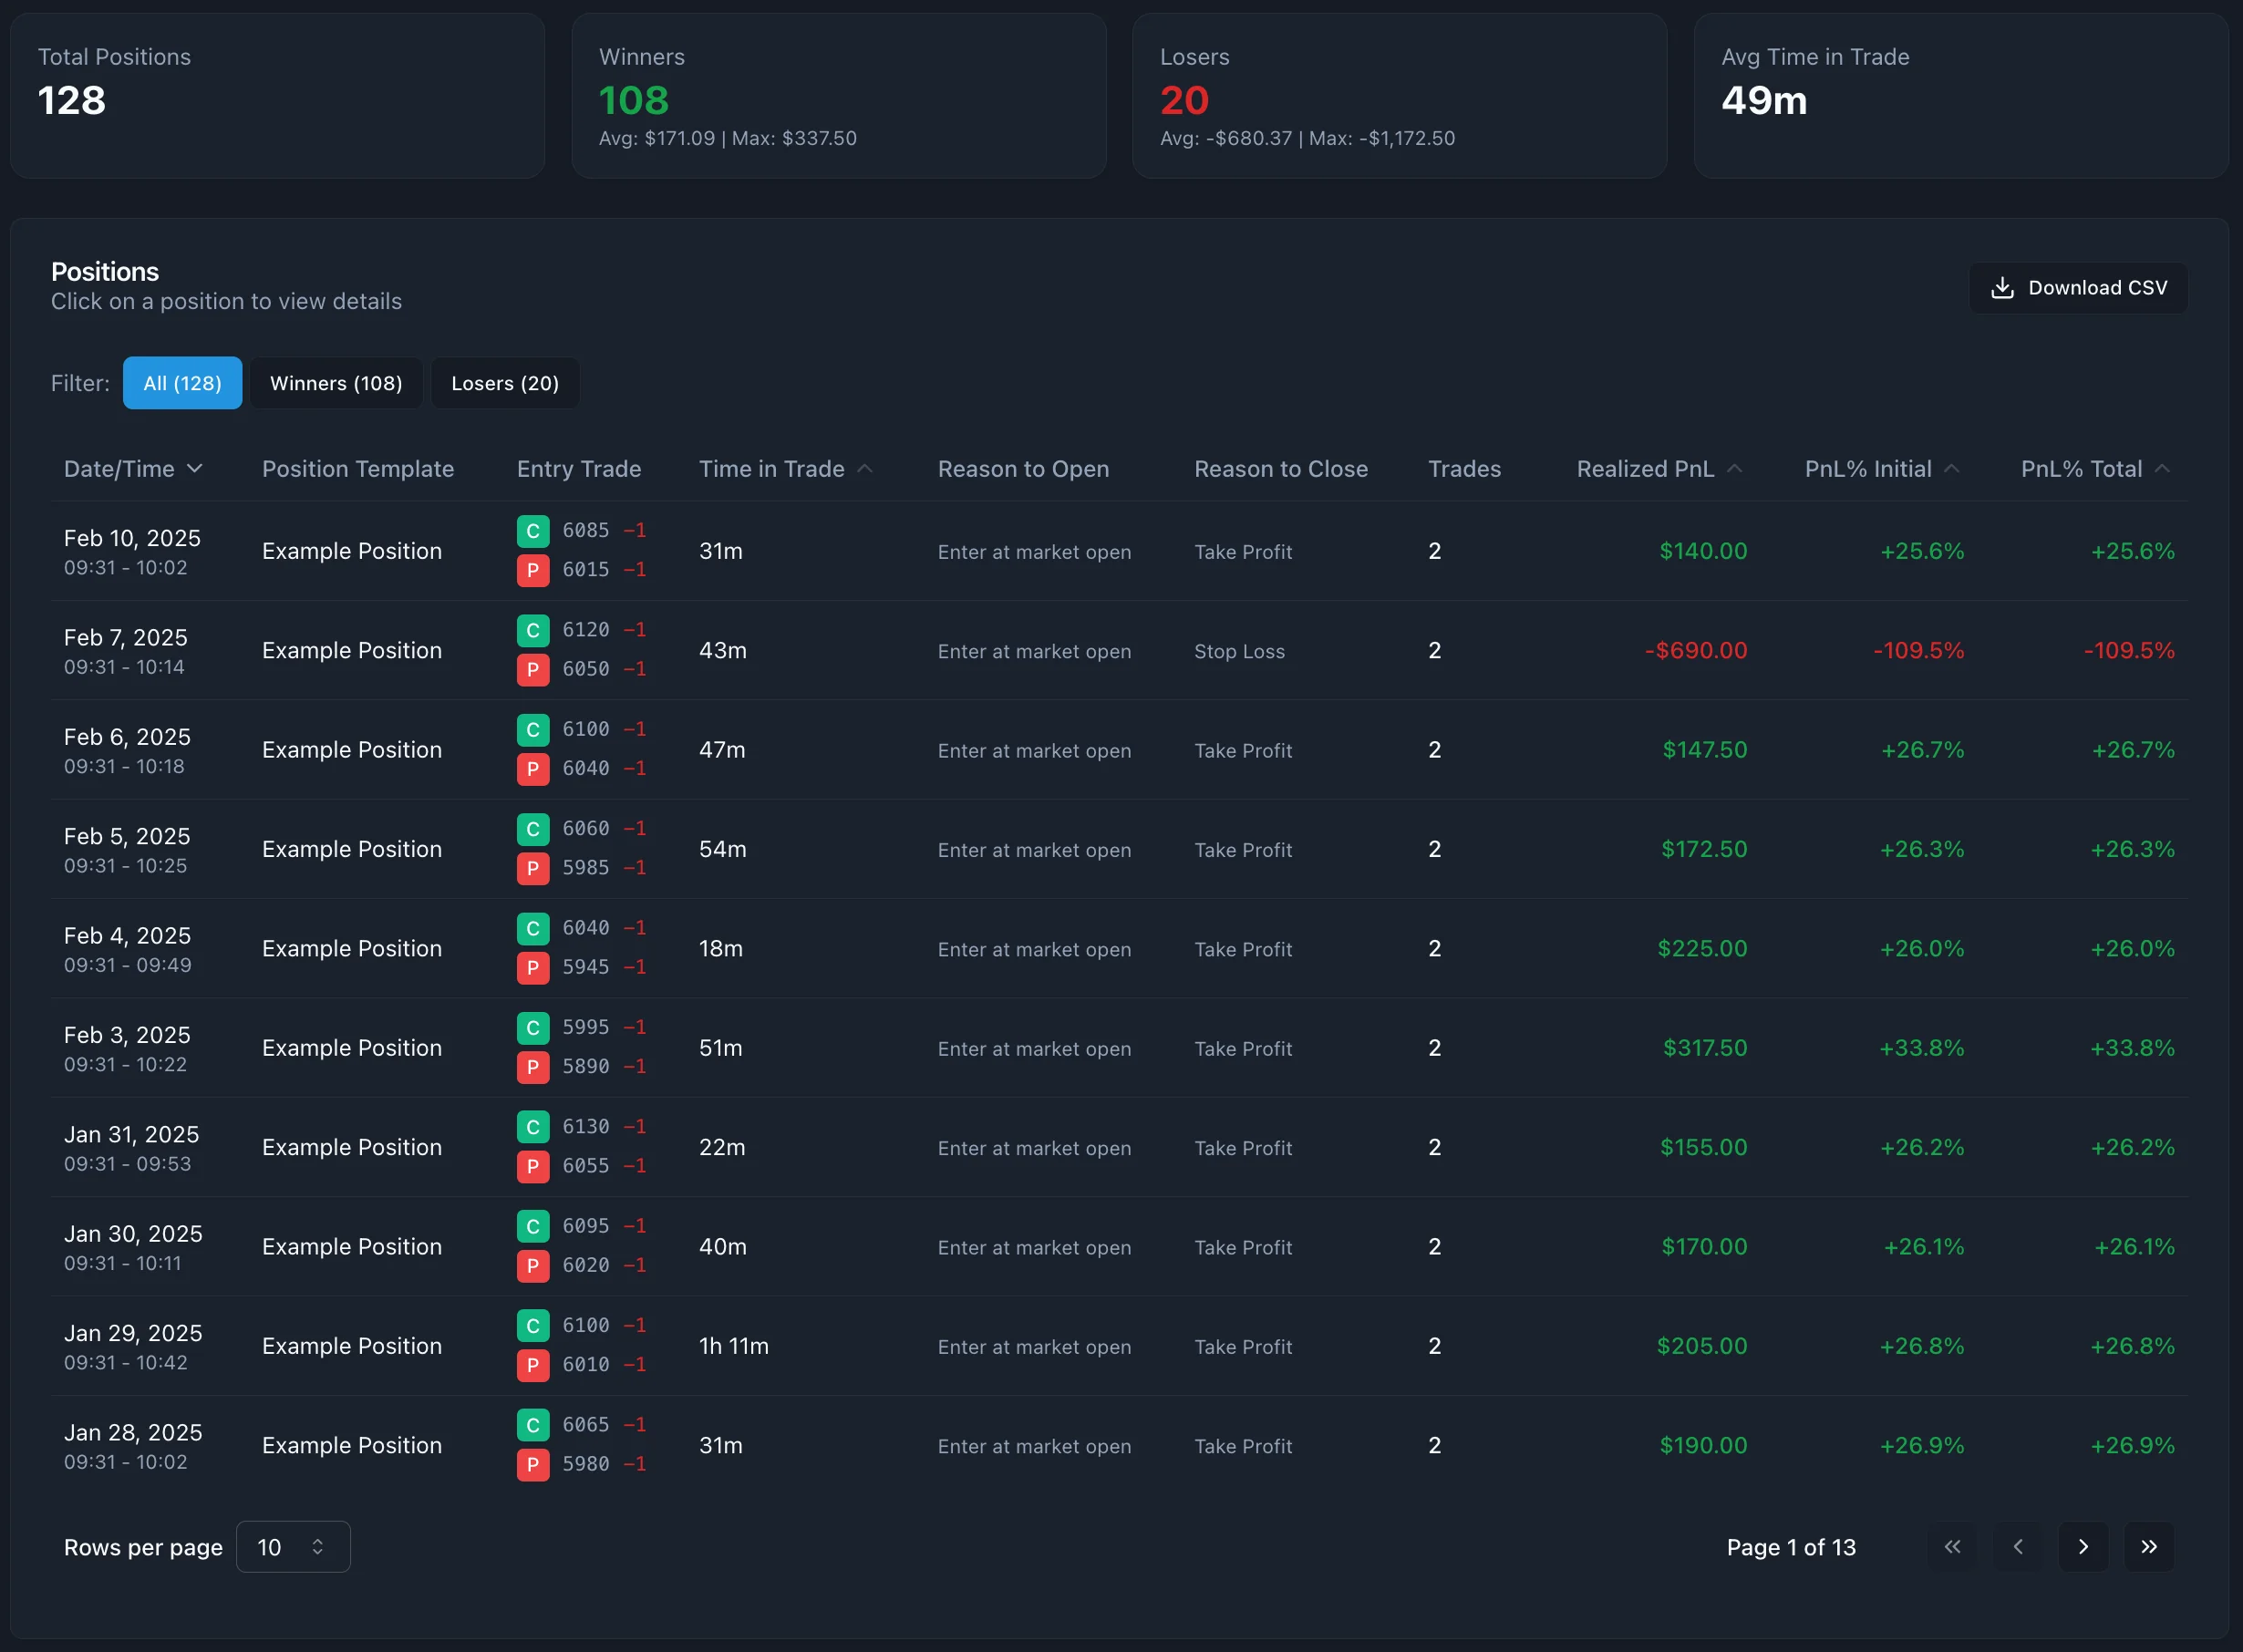
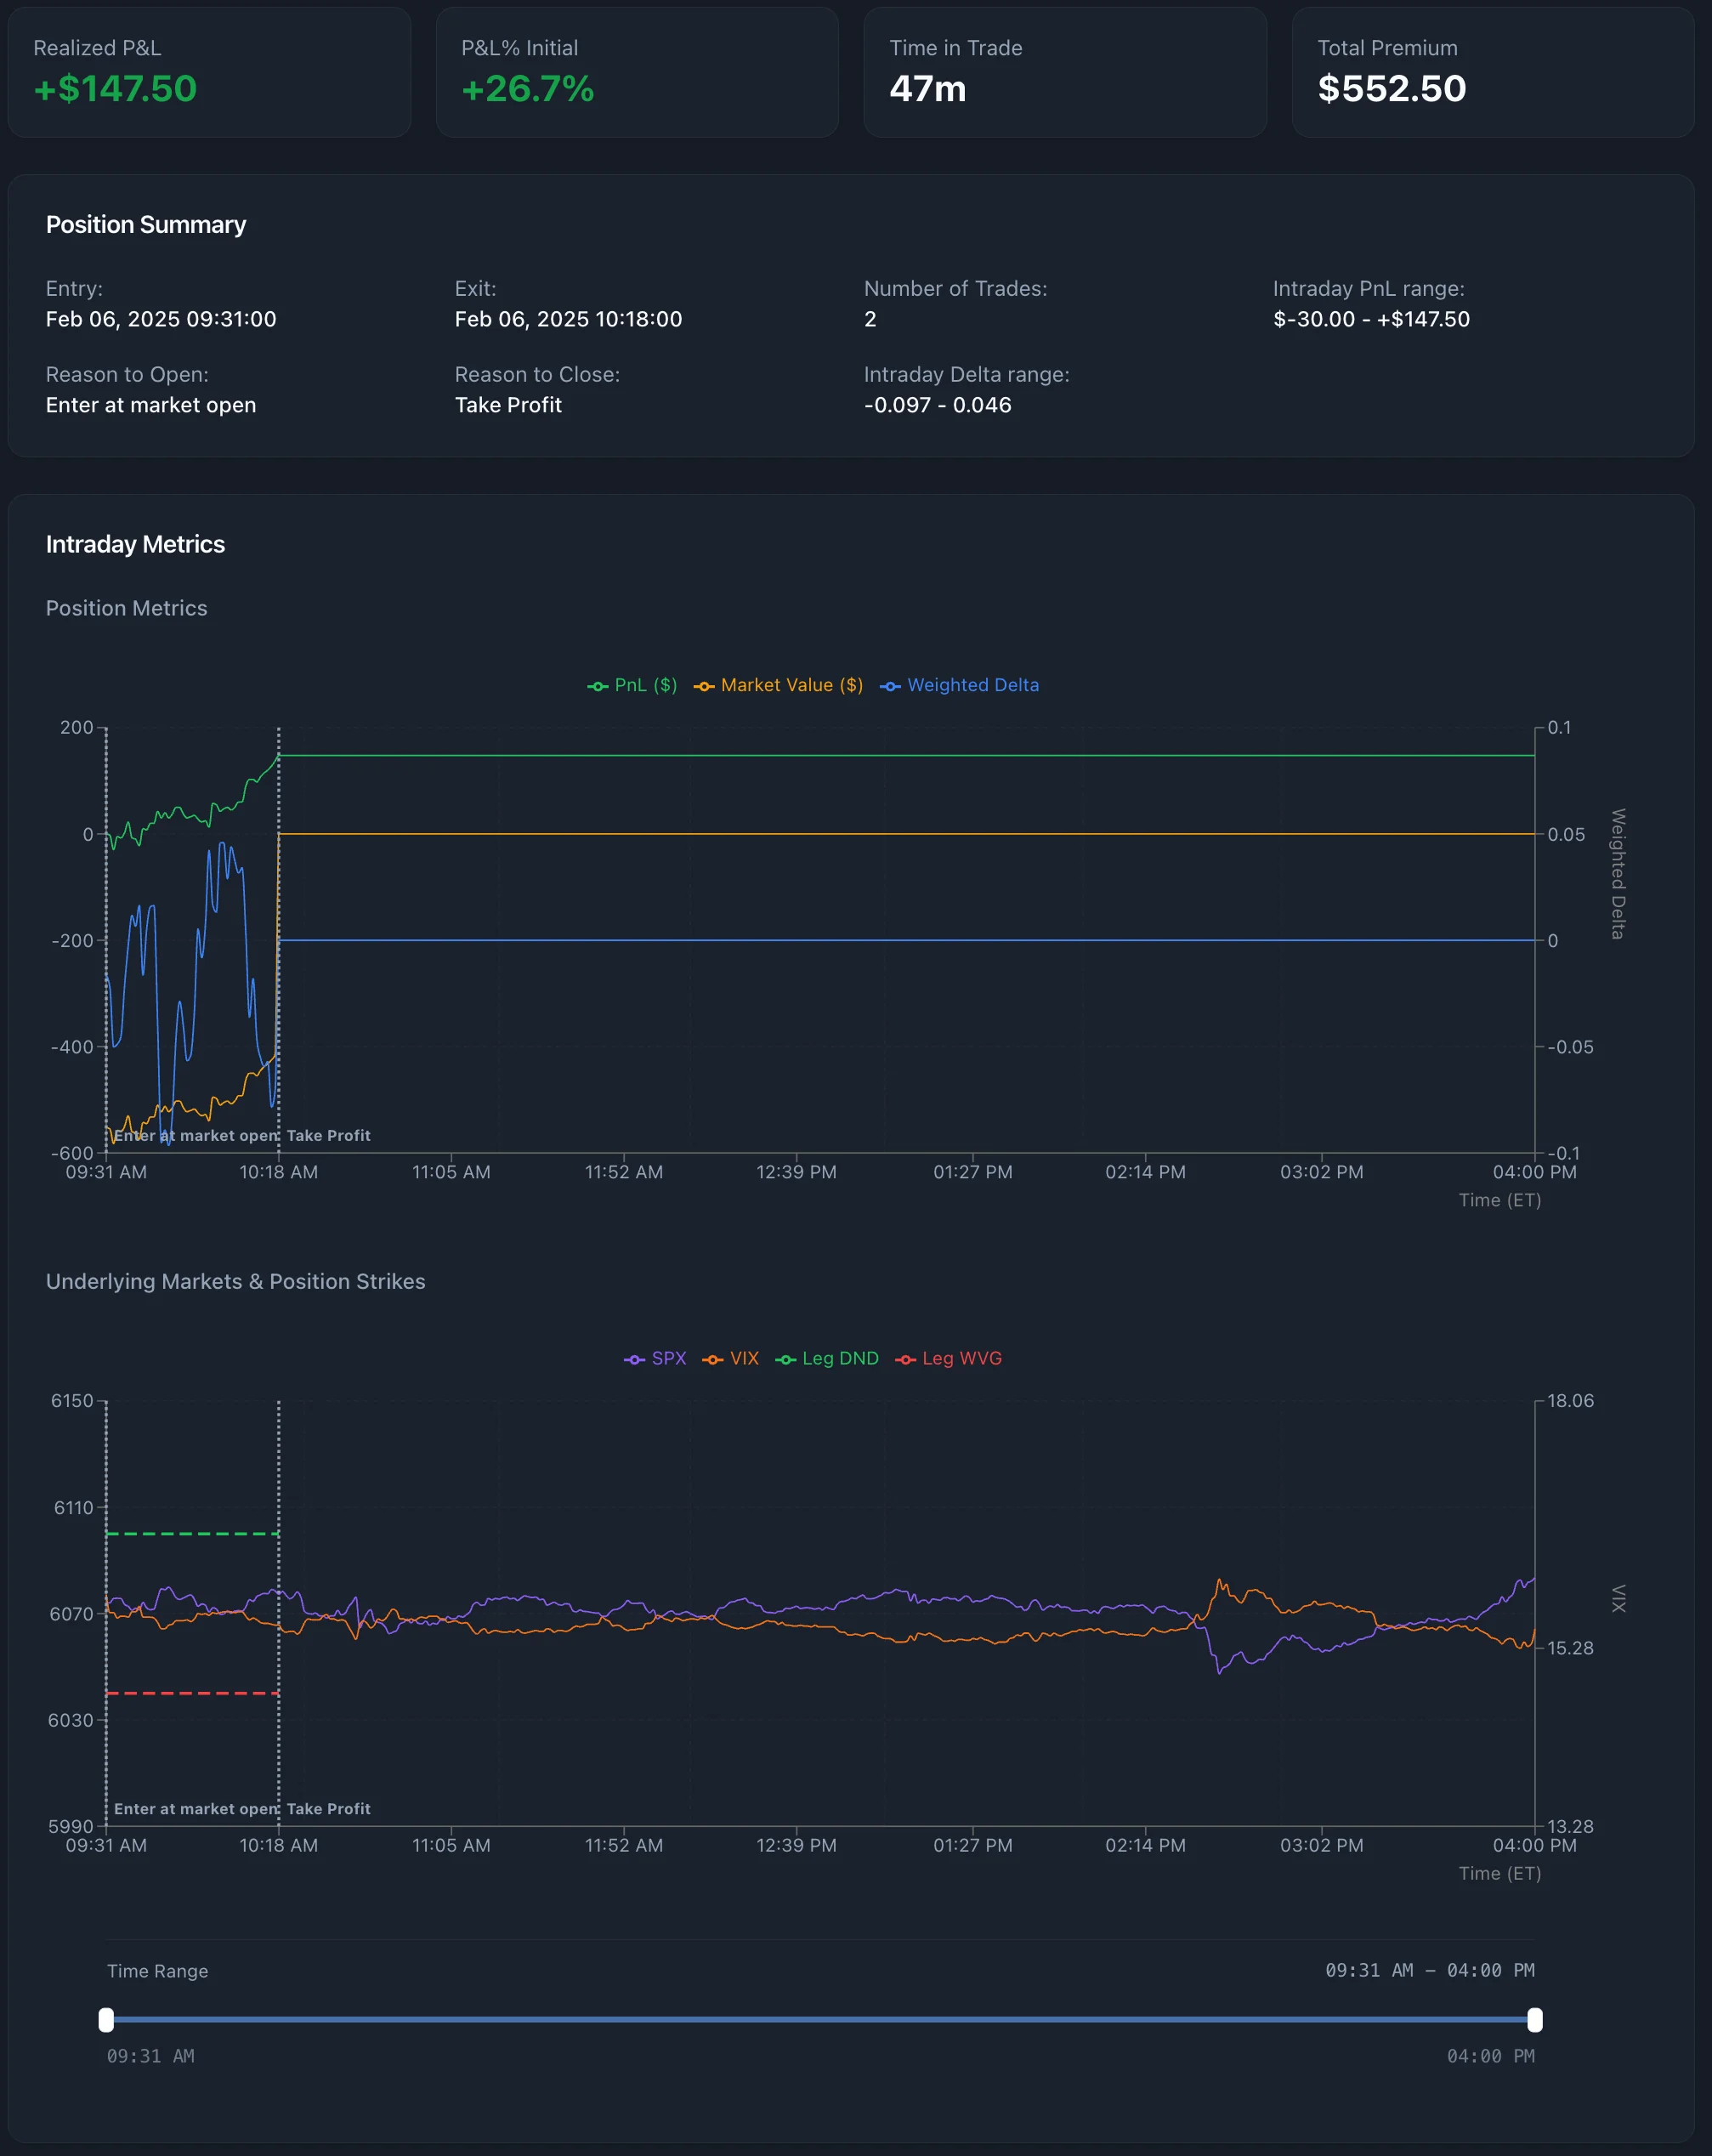
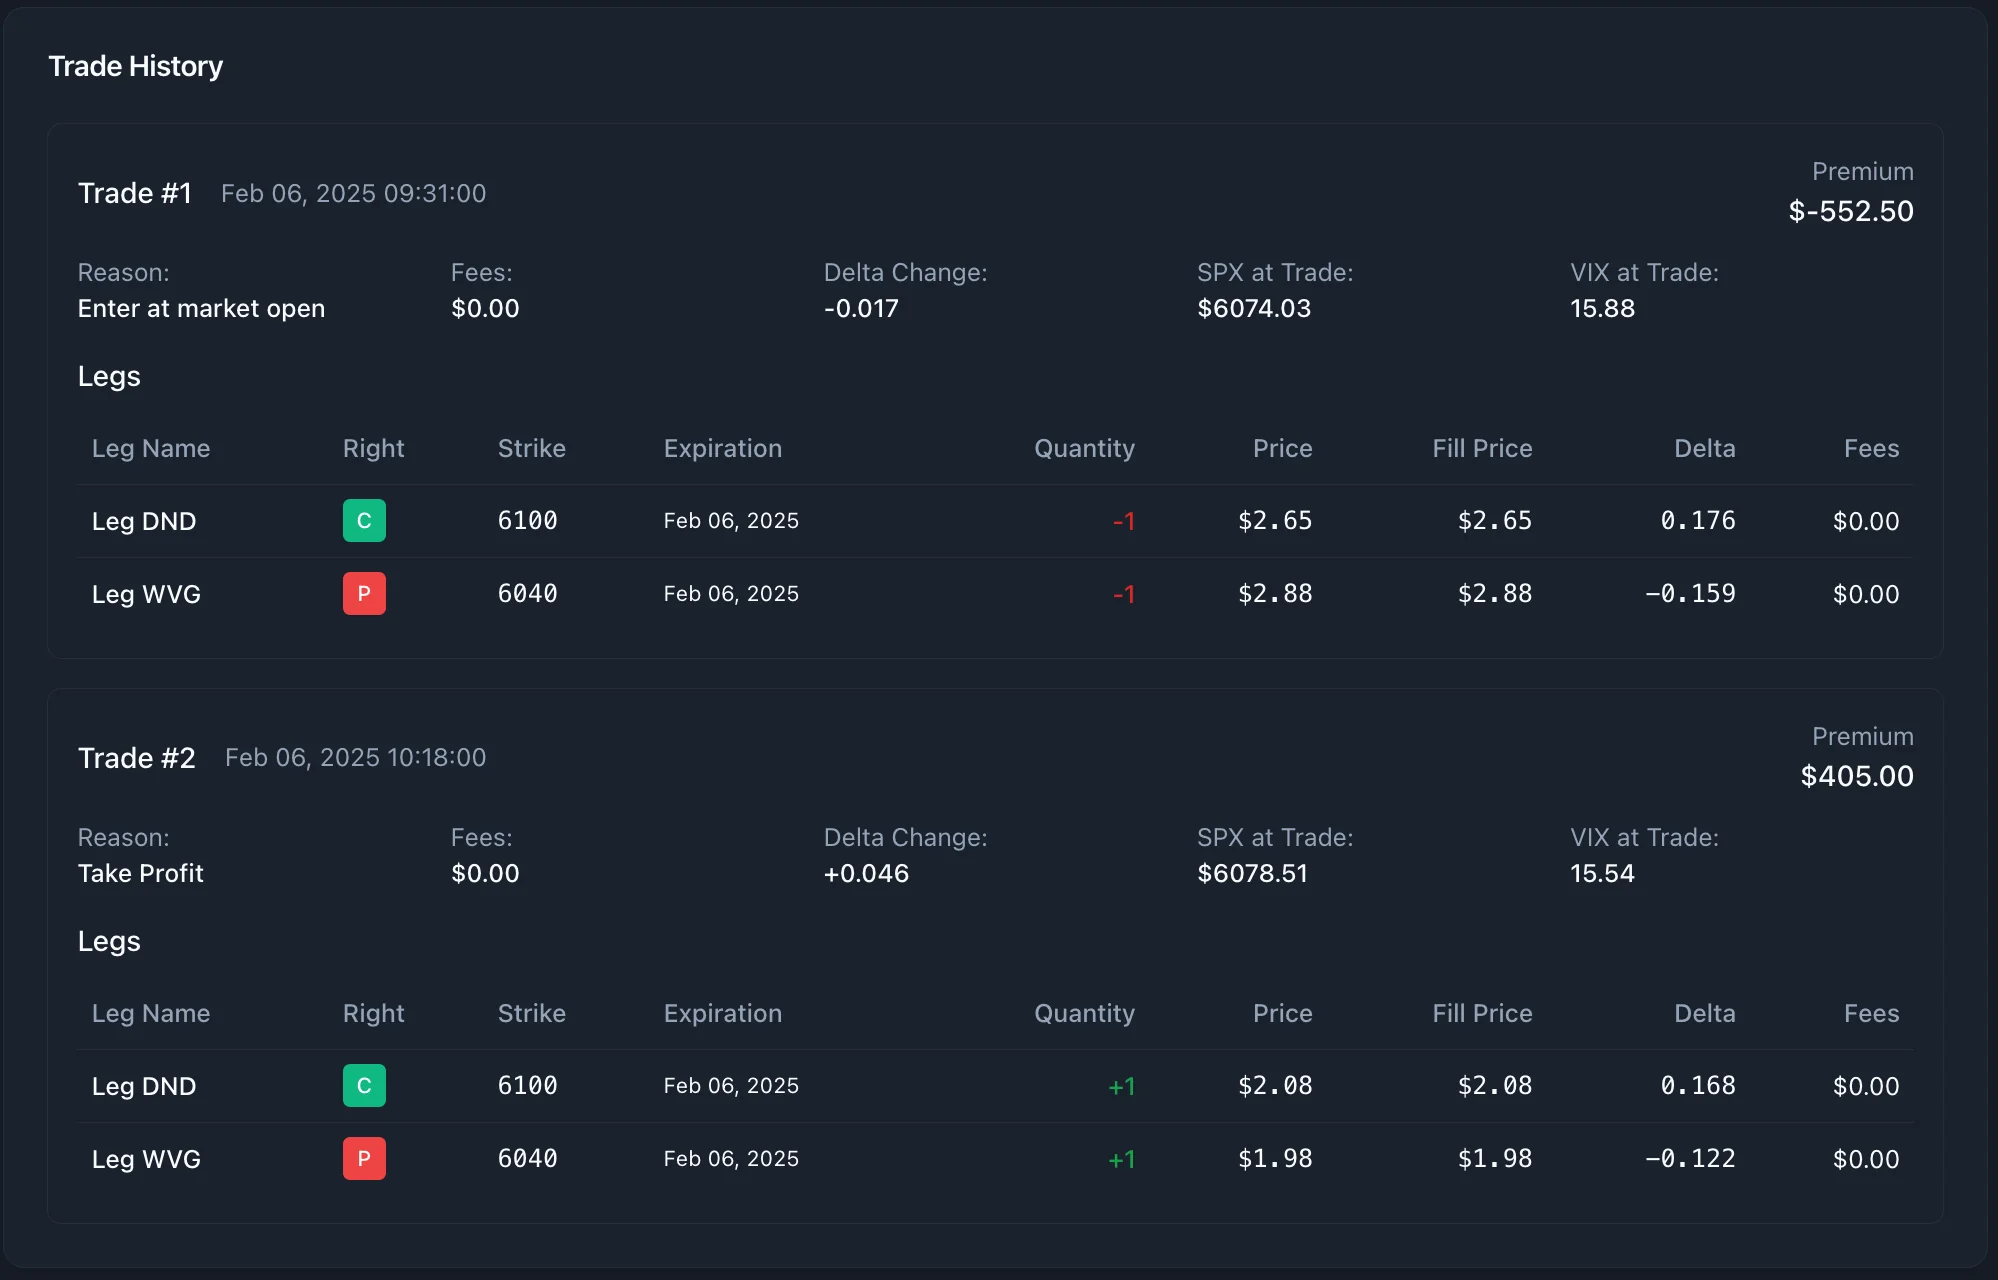
Shows every individual trade with detailed breakdowns:
- Position list with P&L, dates, and status

Click any position for detailed analysis including intraday charts
- Greeks evolution and underlying price movement
- Entry/exit trade details


Daily Tab

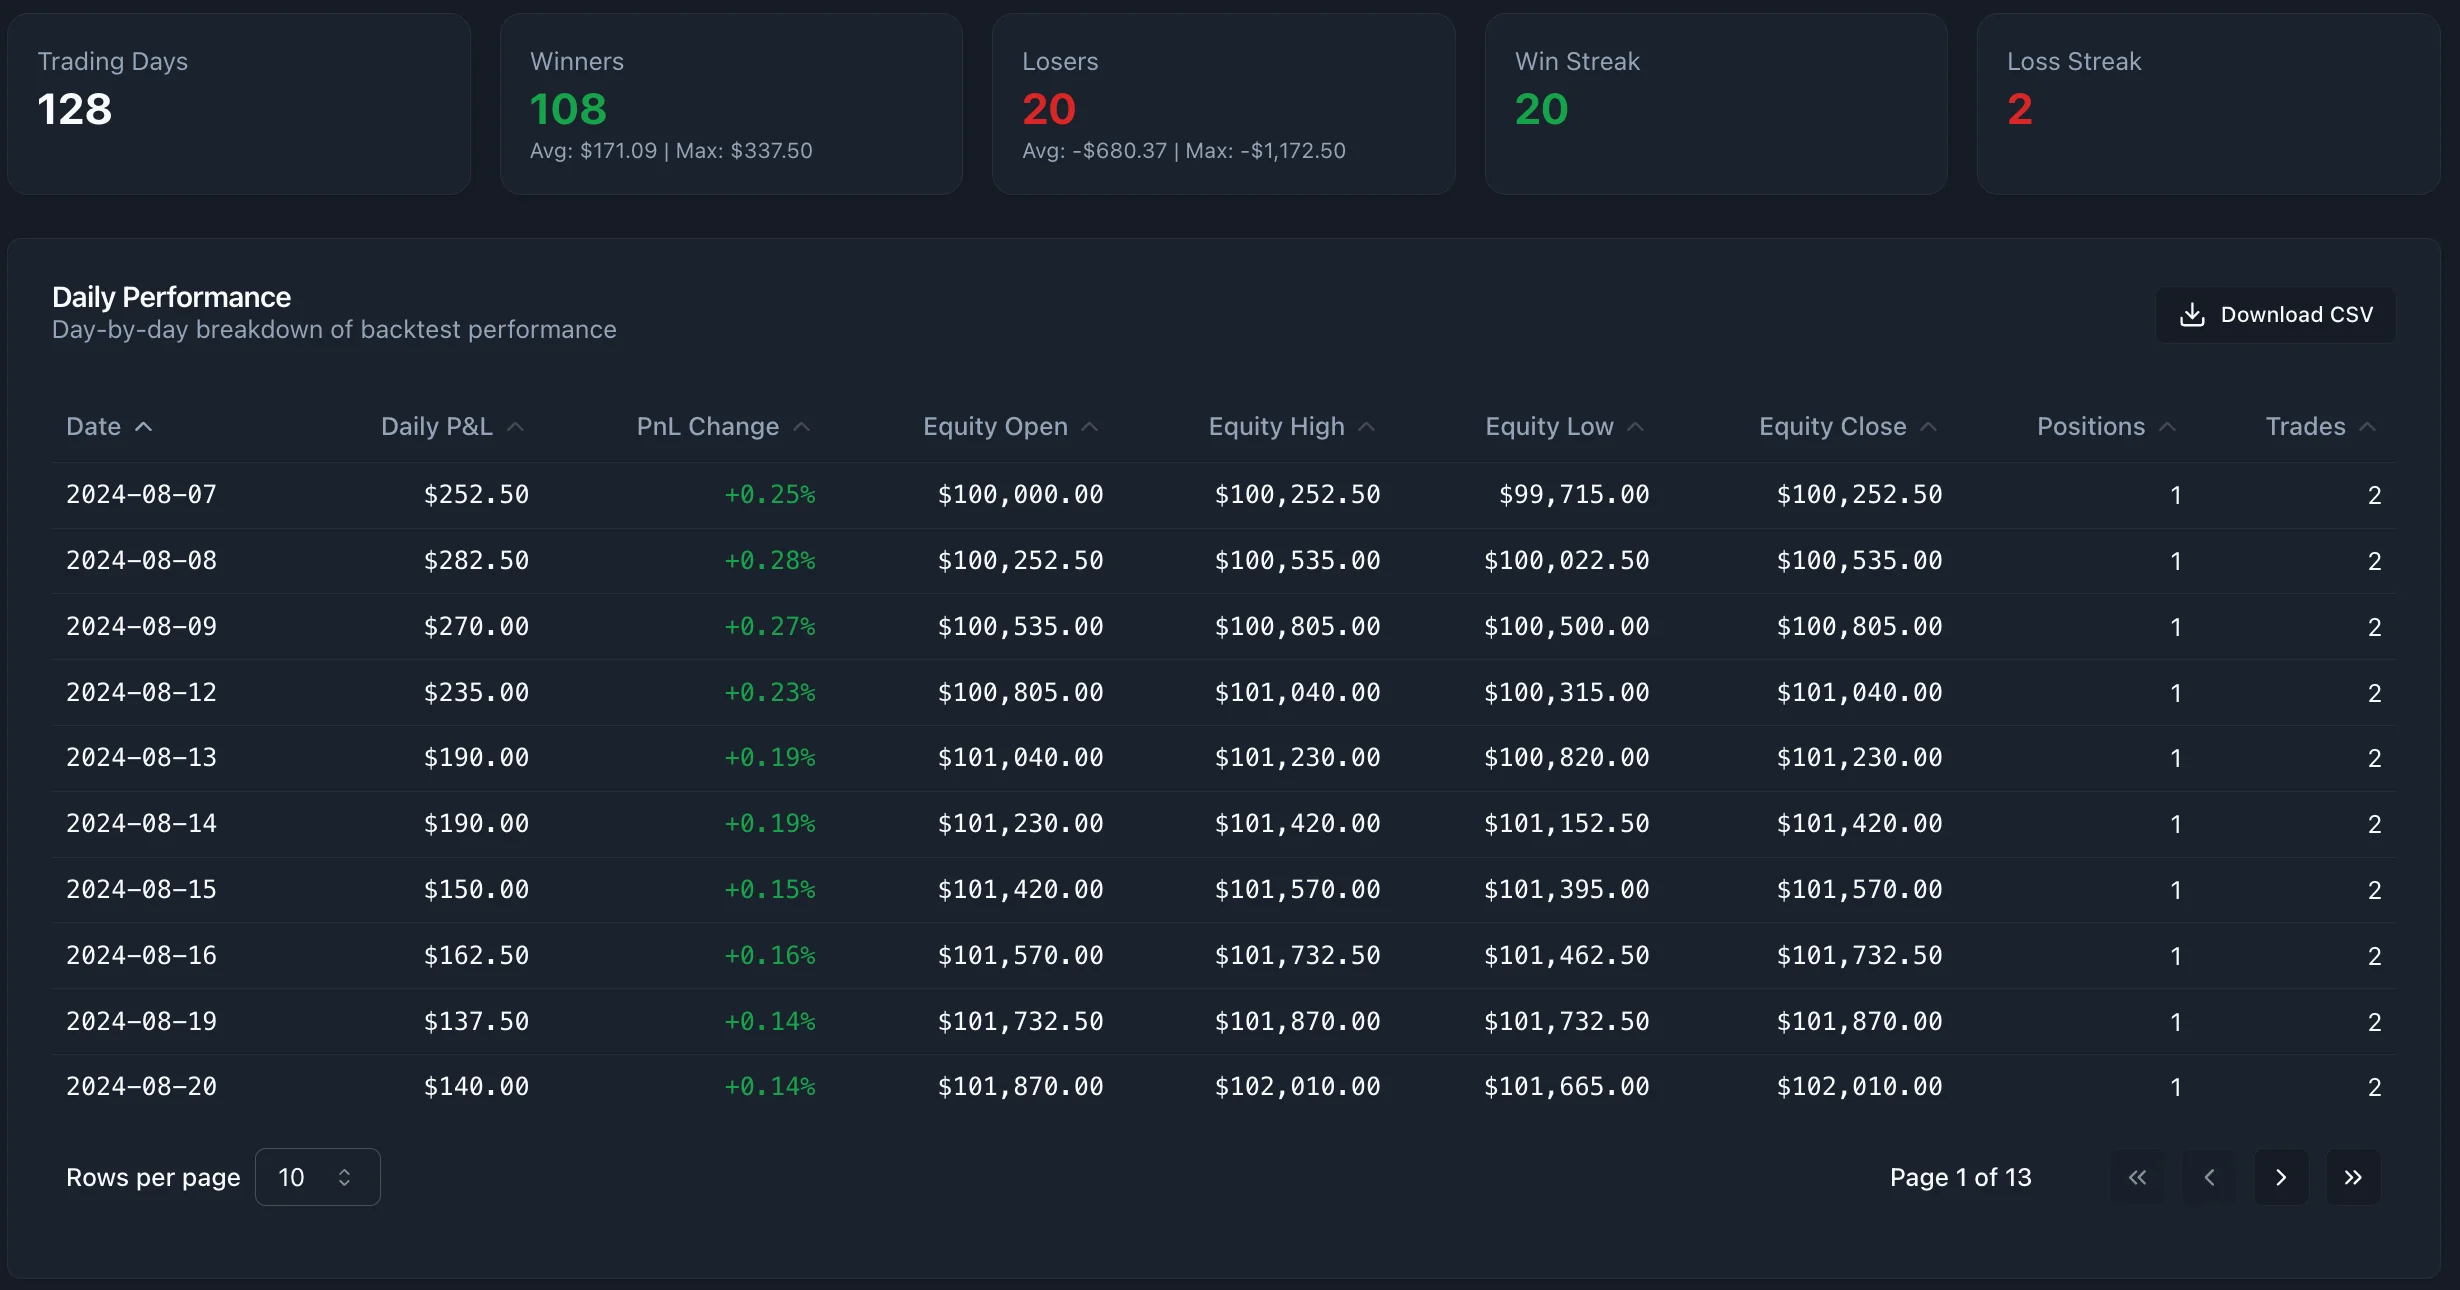
Day-by-day performance breakdown showing:
- Daily P&L and market conditions
- Position activity (opened/closed)
- Risk metrics (delta, gamma exposure)
- Cumulative performance tracking
Strategy Tab

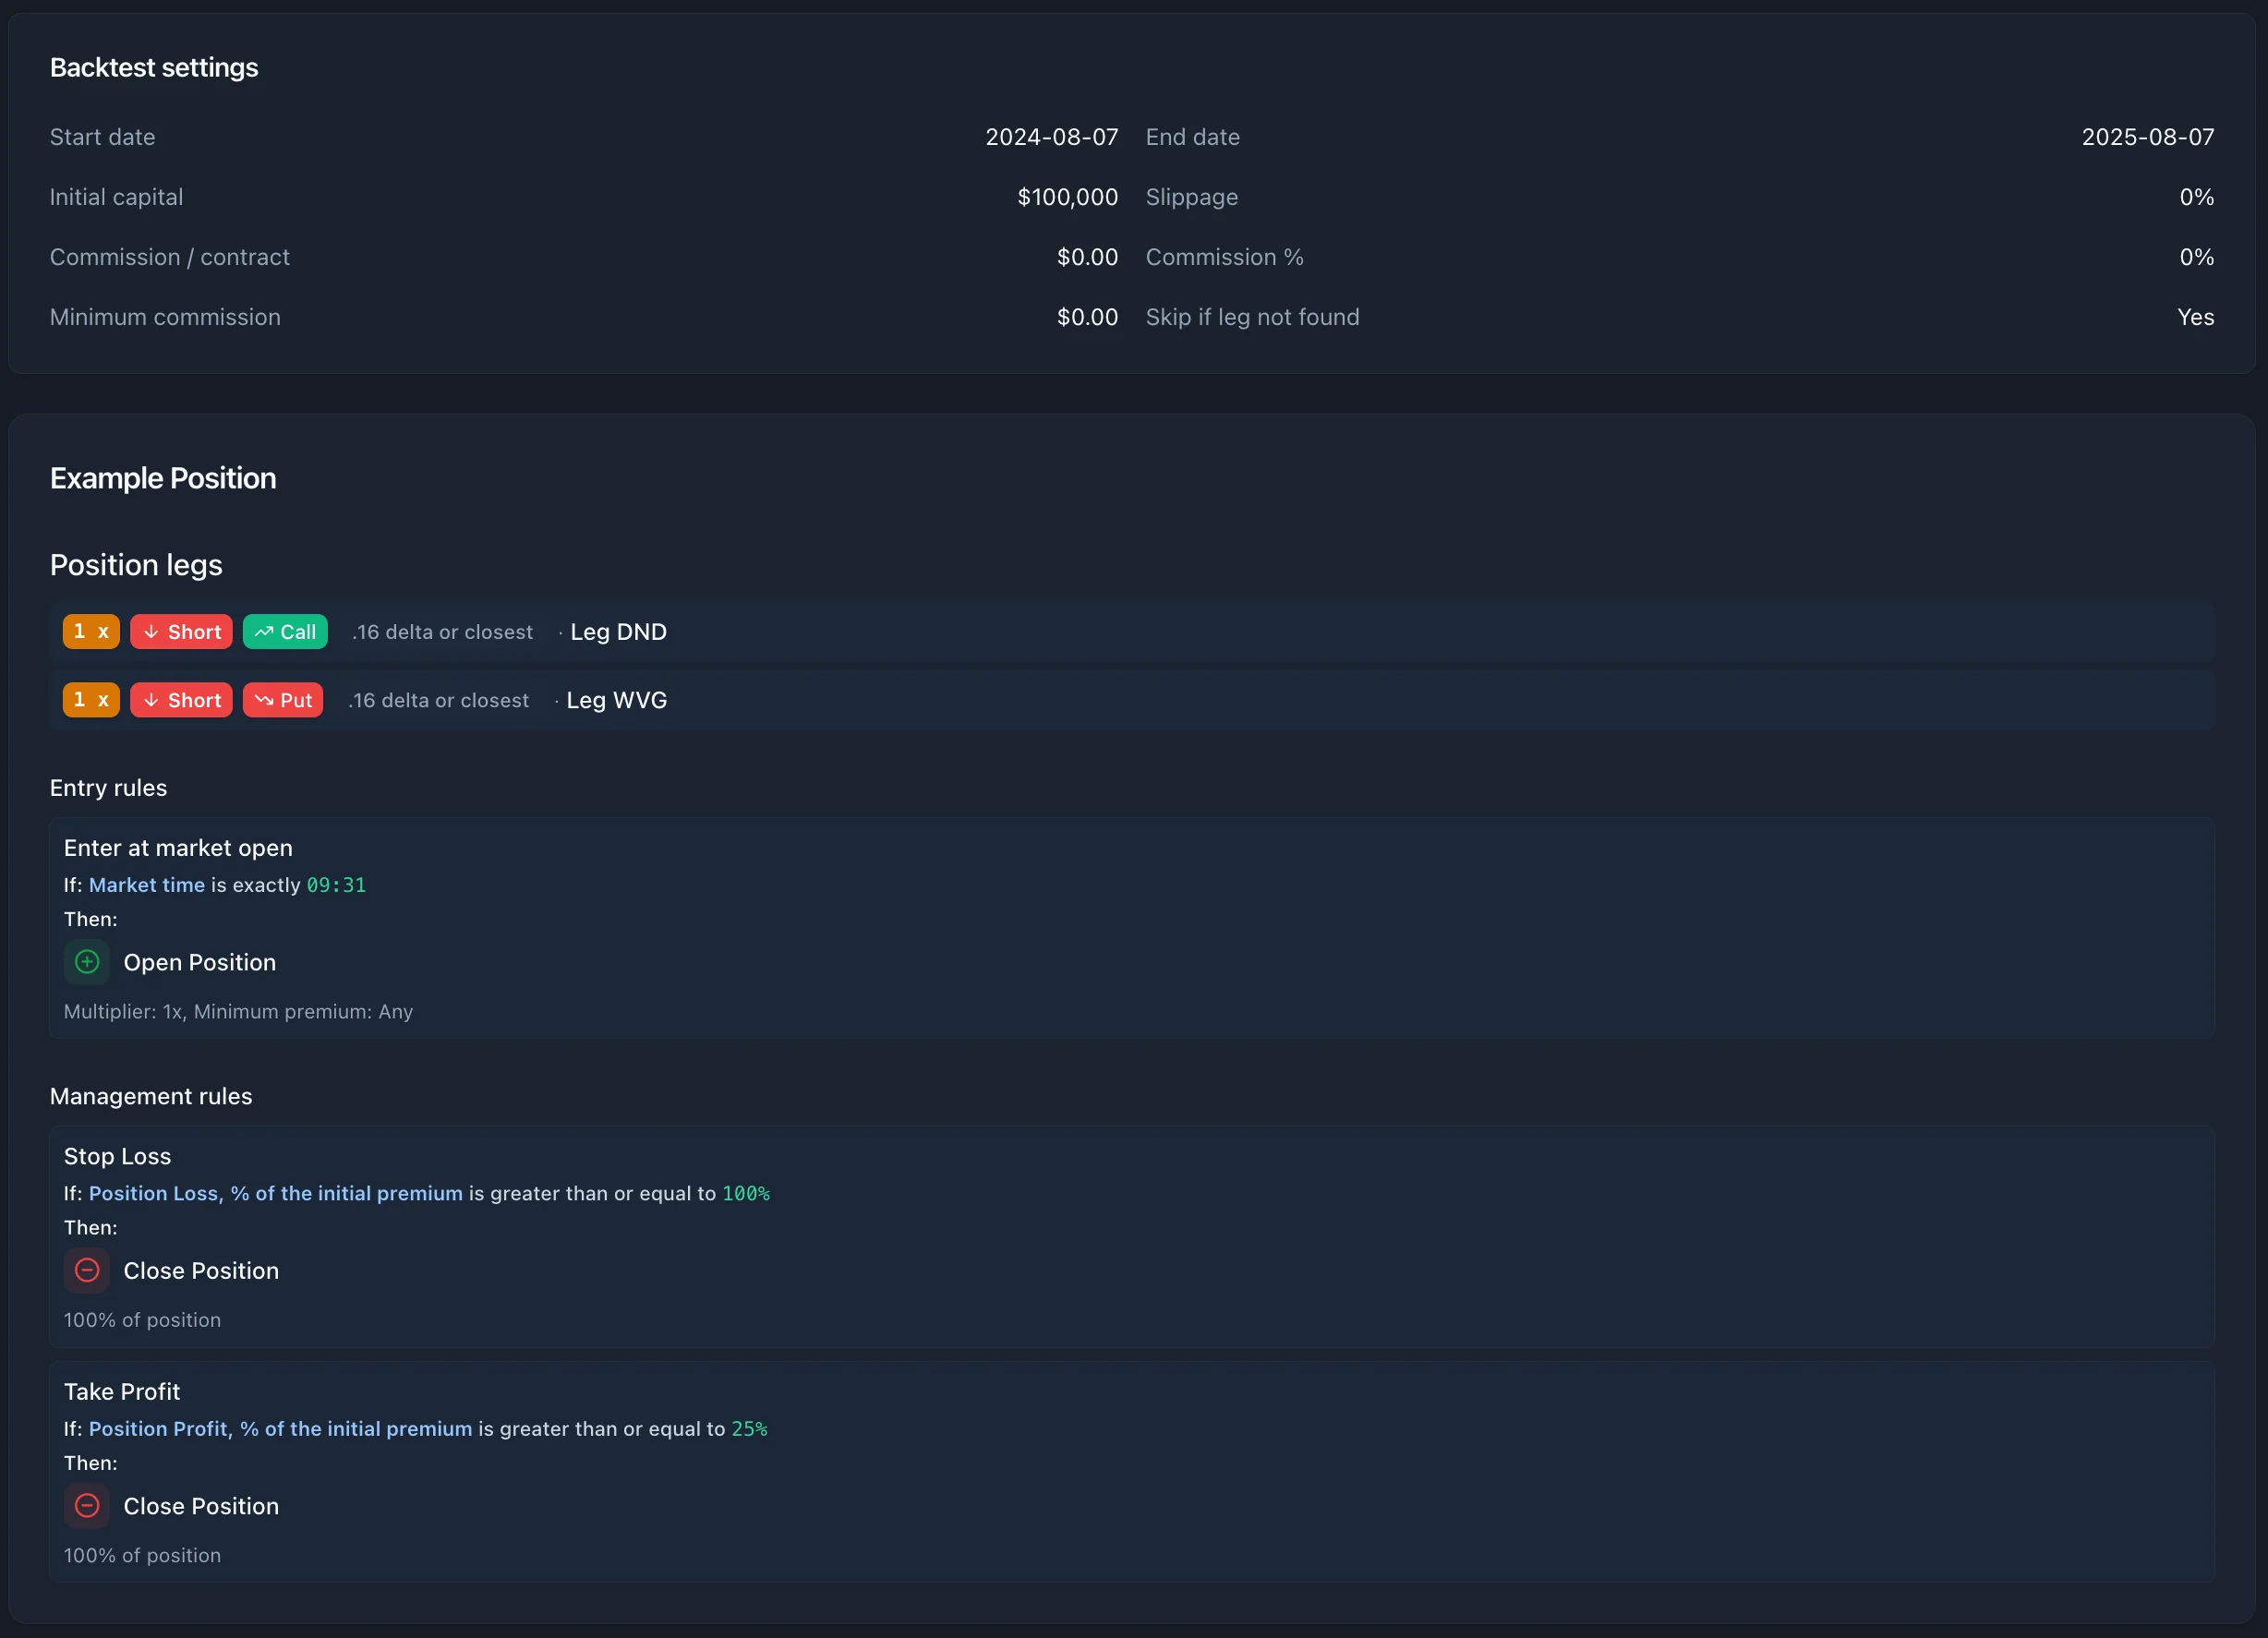
Shows a snapshot of your exact strategy configuration used for the backtest:
- Backtest settings (dates, capital, commissions)
- Position templates and leg configurations
- All rules and conditions exactly as they were run
Using Your Results
- Start with Overview: Check key metrics and equity curve
- Use Insights: Find what market conditions work best for your strategy
- Review Positions: Look at individual trades for patterns
- Check Daily Performance: Identify problem periods
- Improve Strategy: Add conditions based on insights, test again
Next Steps
Now that you understand how to analyze backtest results, continue improving your trading strategies:
- Backtest Settings - Optimize your testing parameters for more realistic results
- Strategy Basics - Build more sophisticated strategies based on your insights
- Rules Overview - Add conditions and actions based on performance patterns
- Custom Expressions - Create advanced logic for complex market conditions