Backtest Comparison & Portfolio Combination
Compare multiple backtests side-by-side and combine them into weighted portfolios to analyze diversification benefits and portfolio performance.
Overview
The comparison tool helps you:
- Evaluate variants - Compare different strategy configurations
- Find diversification - Analyze correlation between strategies
- Build portfolios - Combine backtests with custom weights
- Optimize allocation - Test different weight distributions
Starting a Comparison
From Backtests List
- Select 2-10 backtests using checkboxes
- Click "Compare & Combine" button
- Comparison page opens with your selected backtests
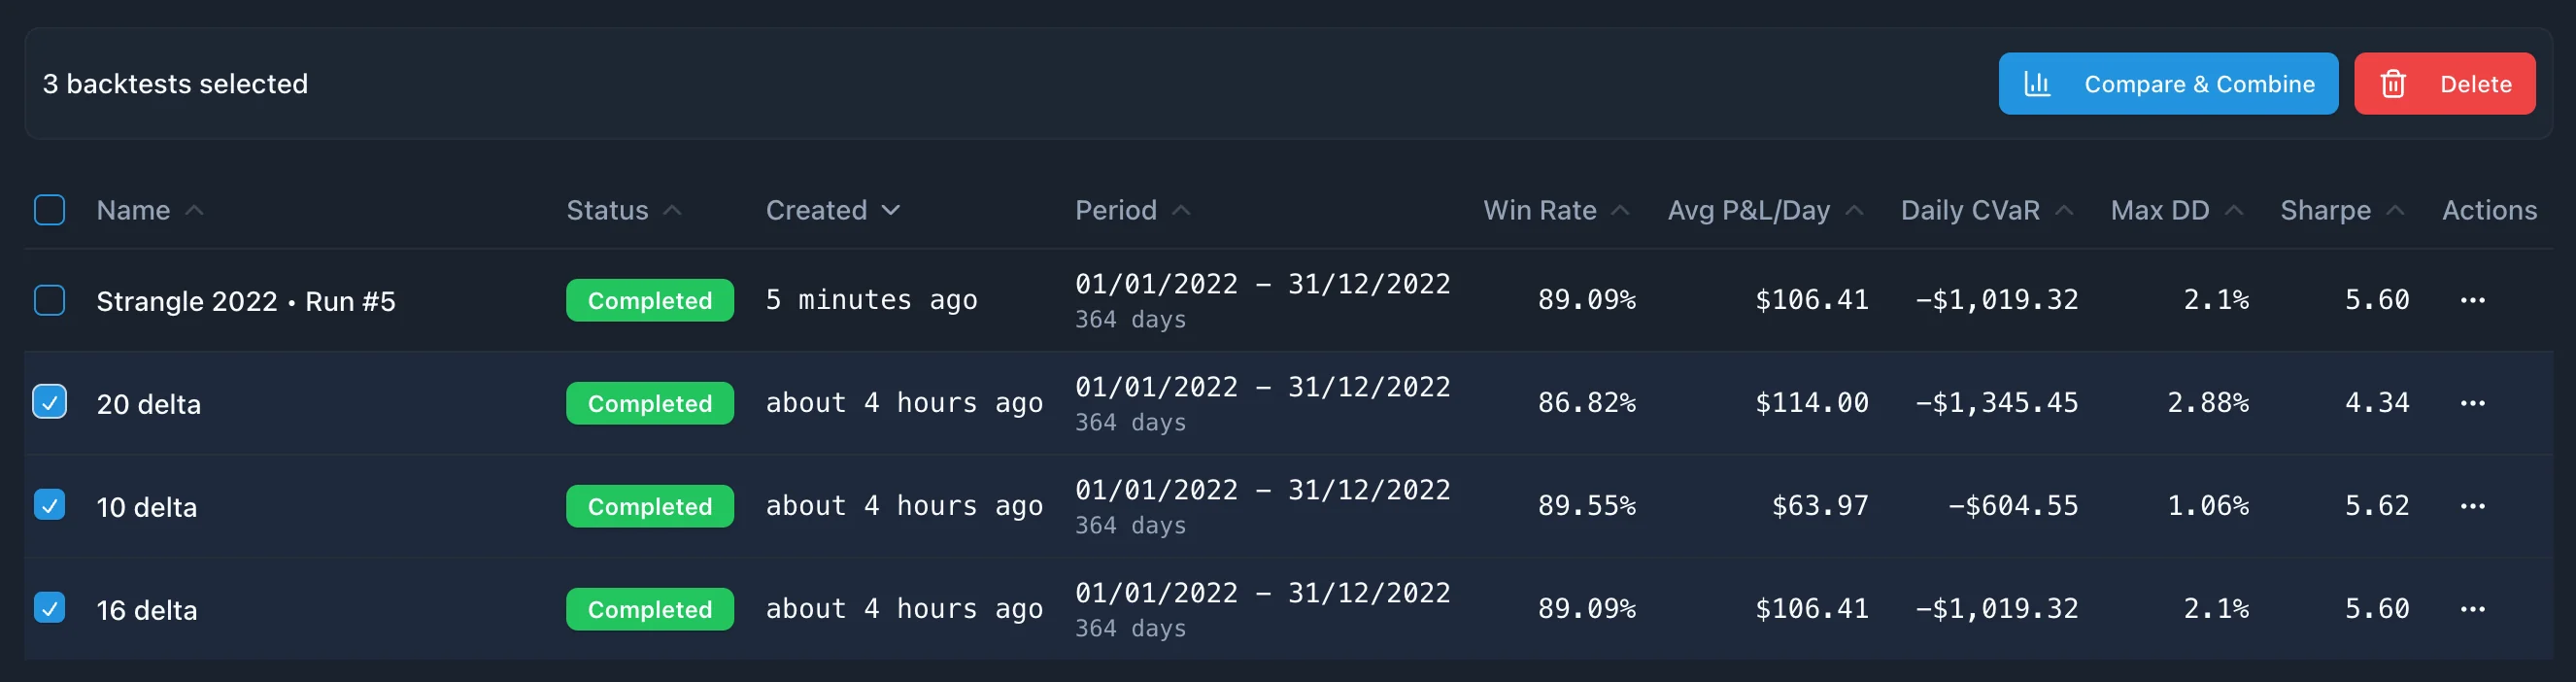
Requirements
- Minimum: 2 backtests
- Maximum: 10 backtests
- Status: Only completed backtests can be compared
Comparison View
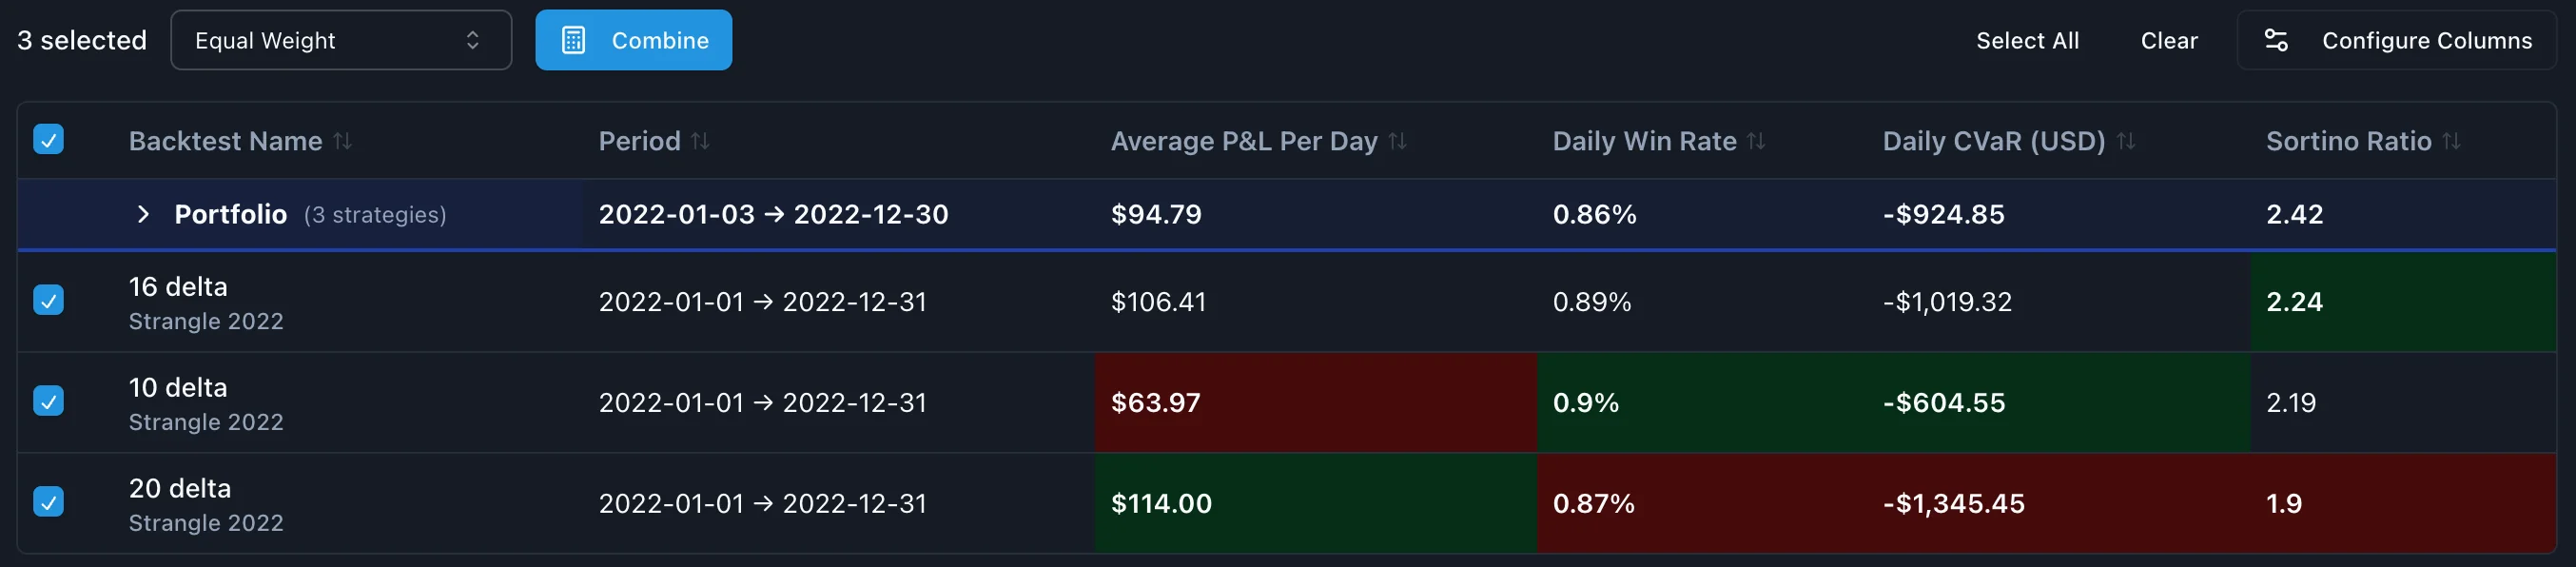
Metrics Table
The comparison table shows key performance metrics side-by-side for easy comparison:
Customizable Columns:
- Click "Configure Columns" to select which metrics to display
- Choose from all available backtest metrics
- Default view: Average P&L per day, Win rate, CVaR, Sortino ratio
- Customize to focus on metrics most relevant to your analysis
Visual Features:
- 🟢 Green background = Best performing value in that column
- 🔴 Red background = Worst performing value in that column
- Sortable columns - Click header to sort (asc → desc → reset)
- Sticky name column - Remains visible when scrolling horizontally
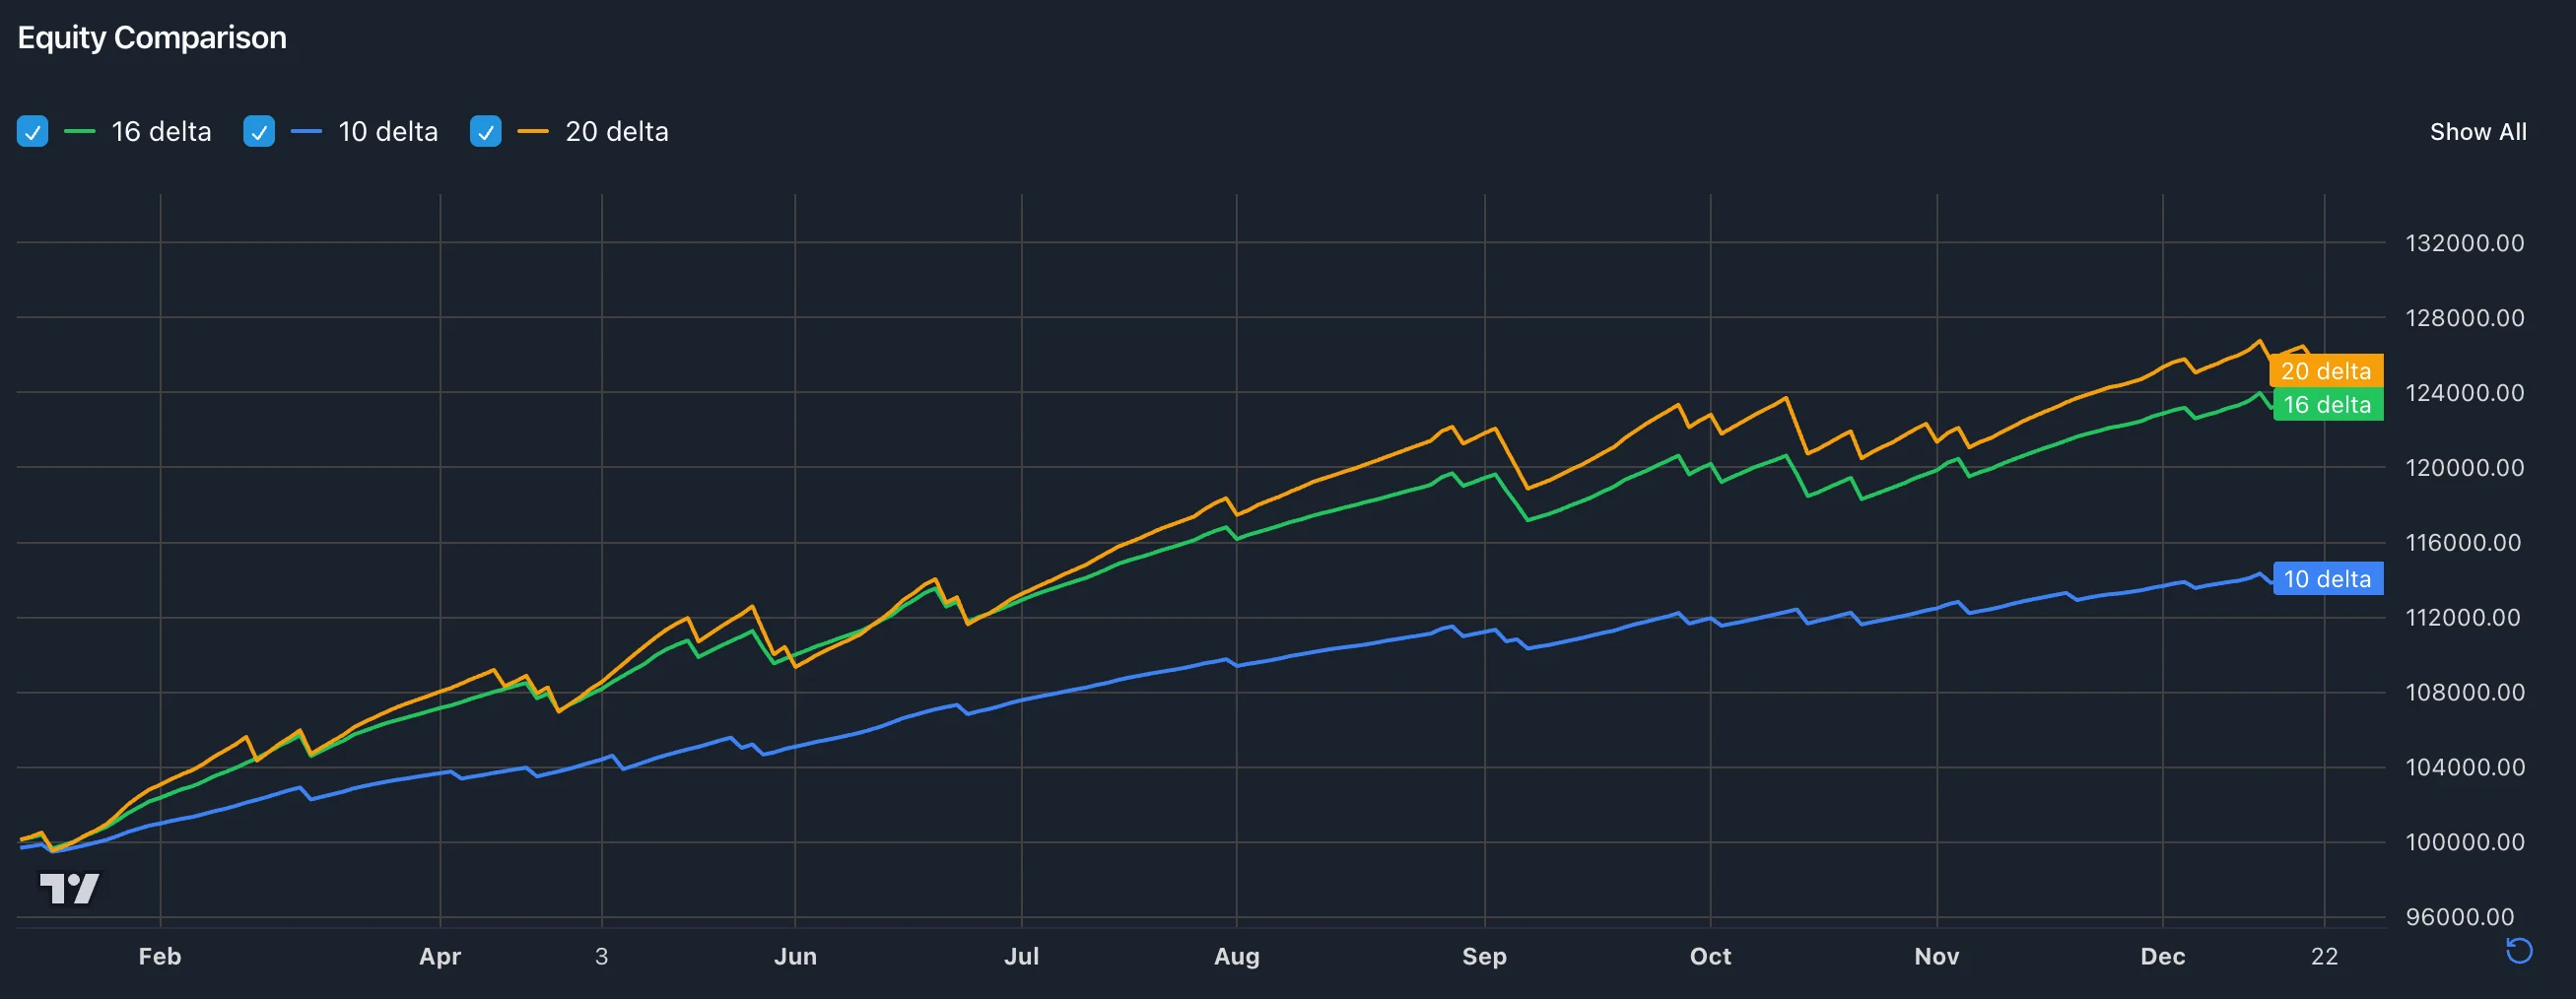
Equity Curves
Visualize all equity curves on a single chart:
- Overlay view - All curves on one chart
- Toggle visibility - Show/hide individual curves
- Zoom & pan - Examine specific periods
- Legend - Click to toggle curves on/off
Identify:
- Which strategies perform better in different market conditions
- Drawdown periods across strategies
- Recovery patterns and consistency
Correlation Matrix
Understand how strategies move together:
Interpretation:
- +1.0 = Perfect positive correlation (move together)
- 0.0 = No correlation (independent)
- -1.0 = Perfect negative correlation (move opposite)
Color Scale:
- 🔴 Red (high correlation) - Limited diversification
- 🟡 Yellow (moderate) - Some diversification benefit
- 🟢 Green (low/negative) - Excellent diversification
Minimum Data: Requires 30+ overlapping trading days between backtests.
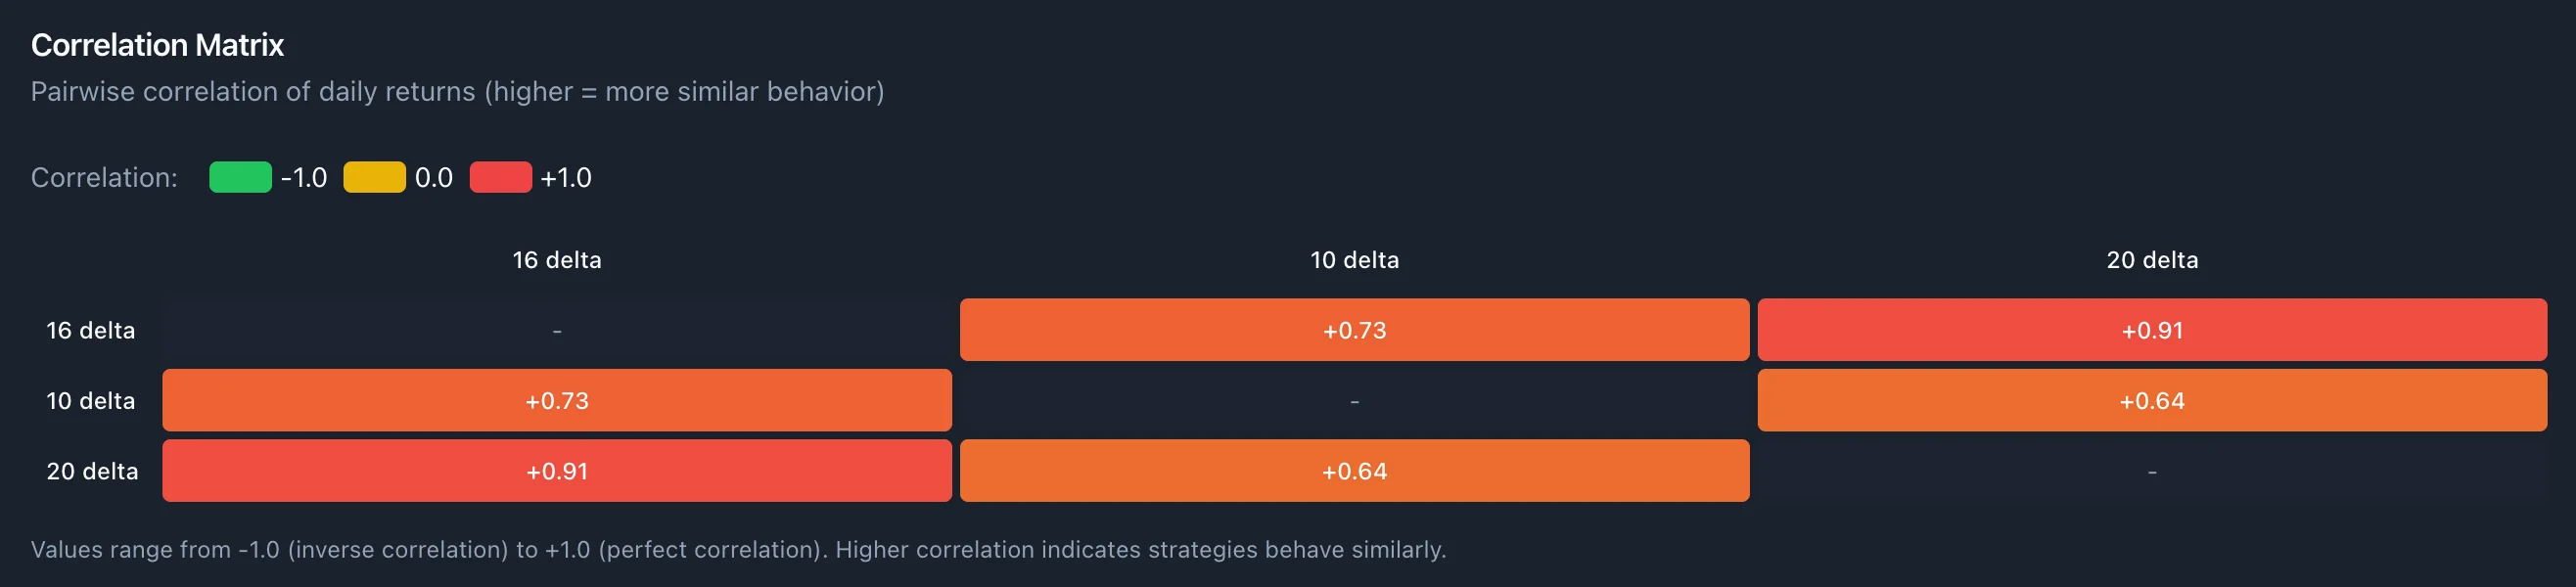
Finding Good Diversification:
- Look for correlation < 0.5
- Negative correlation provides hedging benefits
- High correlation (>0.8) offers minimal diversification
Portfolio Combination
Combine backtests into a weighted portfolio to:
- Test diversification benefits
- Optimize risk-adjusted returns
- Evaluate multi-strategy approaches
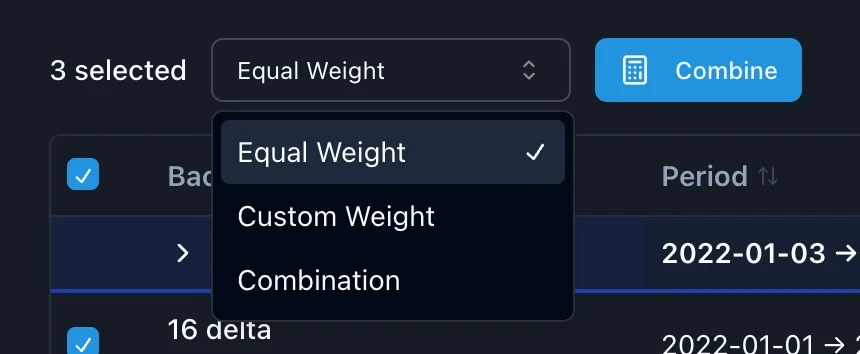
Combination Modes
1. Equal Weight (Standard Portfolio)
- All weights sum to exactly 1.0
- Example:
[0.5, 0.5] = 50% in each strategy
- Use for: Balanced diversification
2. Custom Weight (Flexible Allocation)
- Weights can sum to any value
- Example:
[0.7, 0.8] = 150% total (1.5x leverage)
- Use for: Risk-adjusted or leveraged portfolios
3. Combination (Parallel Strategies)
- Strategies run simultaneously at full or reduced scale
- Example:
[1.0, 1.0, 0] = Run first two at full scale
- Use for: Non-overlapping strategies (different times/conditions)
Creating a Portfolio
- Select Backtests: Check the strategies to include
- Choose Mode: Select combination mode
- Adjust Weights: Set weight for each strategy
- Combine: Click "Combine Portfolio"
- View Results: See combined equity curve and metrics
Portfolio Results
The combined portfolio shows:
- Combined equity curve - Portfolio performance over time
- Recalculated metrics - All metrics computed from combined returns
- Portfolio row - Highlighted in blue at top of comparison table
Common Questions
Q: Why can't I compare more than 10 backtests?
A: Performance and UI clarity. For more, run multiple comparisons.
Q: What if correlation matrix is empty?
A: Need 30+ overlapping days. Check date ranges align.
Q: Can I save a portfolio as a strategy?
A: Not directly. Clone individual strategies and note portfolio weights.
Q: Do weights have to sum to 1.0?
A: Only in "Equal Weight" mode. "Custom Weight" allows any total.
Q: Why are combined metrics different from averaging?
A: Metrics are recalculated from the combined equity curve for accuracy.
Q: How do I handle different date ranges?
A: System uses overlapping dates only. Non-overlapping days show zero contribution.
Next Steps